

Is the Australian economy heading for recession?
Demand for executives continues to fall in 2024
Engineering projects see a significant decline
Demand for Executive Positions in Australia in February 2024
The warning bells are ringing with a threatening rise in unemployment. Vacancies for executives fell another 9 per cent according to the E.L. Executive Demand Index.
Mr Grant Montgomery, Managing Director of E.L Consult, the leading human resources consulting that has researched and published the E.L. Executive Demand Index for over 30 years, said:
“The E.L Index has now been falling consistently since the beginning of 2023.
“It should be recalled that the EL Index has been shown to be a lead indicator of general employment trends so we expect the ABS numbers will also start to decline as we get further into 2024.
“The E.L Index research executive employment numbers from the previous month, in this case, – February 2024 – some three months ahead of official data collection and those employment numbers collected are for management jobs not general employment.
“This is significant as employers stop hiring expensive management first and only stop skilled and unskilled hiring when their order book has dried up. Hence it leads to what will happen to general employment in the future.
“And now, as we have been predicting, executive employment is in free fall.”
What Does This Mean?
“Significantly this means employers are not confident that their businesses will grow in the future. In fact, the opposite is happening, and they are battening down the hatches.
“All sectors fell from Financial through to Marketing executives but worst of all was Engineering jobs, which strongly correlates to capital investment. Engineering has nosedived 20 per cent.
“It is clear that the Reserve Bank’s use of interest rates is working to slow the economy but this method of bringing down inflation has come with a lot of pain, – particularly to those in middle Australia with mortgages,” Mr Montgomery said.
“Looking back over the last year executive employment has been falling gently at first but more and more.
“On this trend, Australia is heading for recession – that is becoming more and more obvious.
“Let’s hope that the government does not start spending for its next election and primes the inflation pump all over again.”
It is unlikely that the Reserve Bank will be making any major downward moves on official interest
rates before June and if it does then they will be small.
“Even the US which has had lowering inflation for some time now has not attempted to drop rates.”
“While mortgagees and renters are suffering, retirees are probably the only ones doing OK in this environment. Their savings are benefiting from the higher interest rates,” Mr Montgomery said.
In February, the state results were mostly lower. Interestingly, the only positive state was Queensland, with improvements in Finance and Management. Western Australia produced the largest decrease of the larger states.
Demand decreased across all executive sectors during the month, with Finance executive demand the best performing and Engineering the worst.
Call Grant Montgomery on +612 9221 6688 or 0414926688 for further details
February 2023 Statistics
February 2024 National Index
February National Index: 543
Same period last year (February 2023): 674
Percentage change over last month: -9%
National Summary
Demand for Australian executives has fallen another 9 per cent continuing the E.L. Executive Demand Index’s decline. The Index has now been falling fairly consistently since the beginning of 2023.
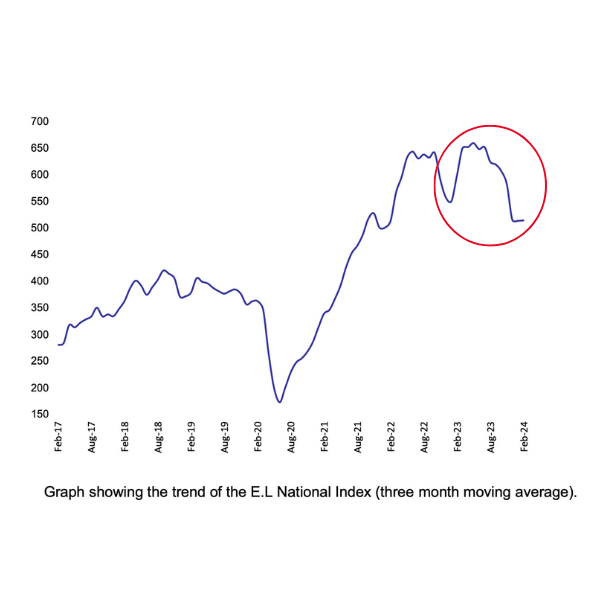
National Demand for Executives Over Last Seven Years
The three-monthly trend figure is now at its lowest level since February 2022 thanks to recent losses.
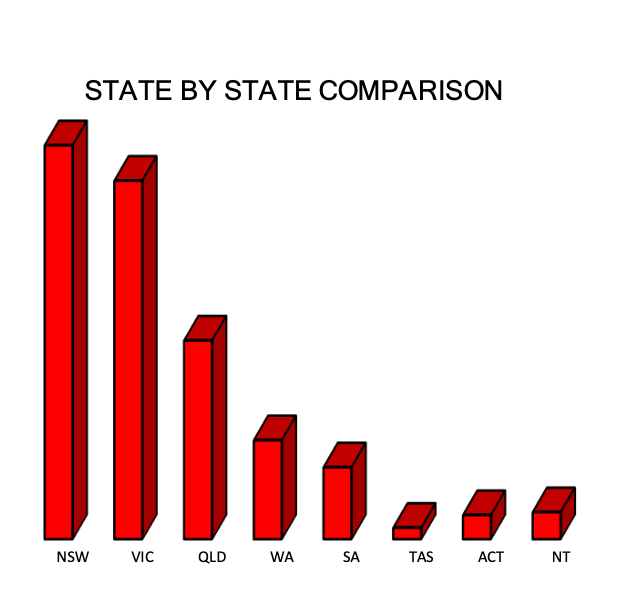
State by State Comparison
Among the states the results were mostly lower. The only higher state/ territory was Queensland, benefiting from improvements in Finance and Management. Western Australia produced the largest decrease of the larger states.
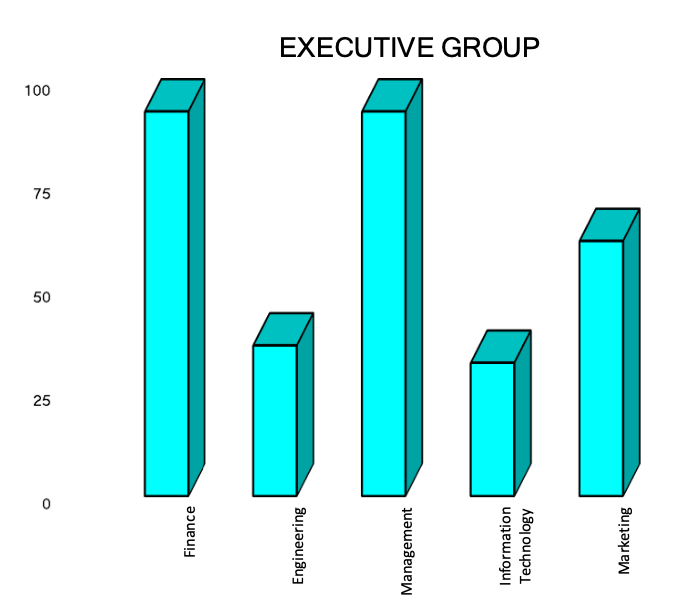
Employment Trends for Executive Groups
Demand decreased across all executive sectors during the month, with Financial the best performing and Engineering the worst.
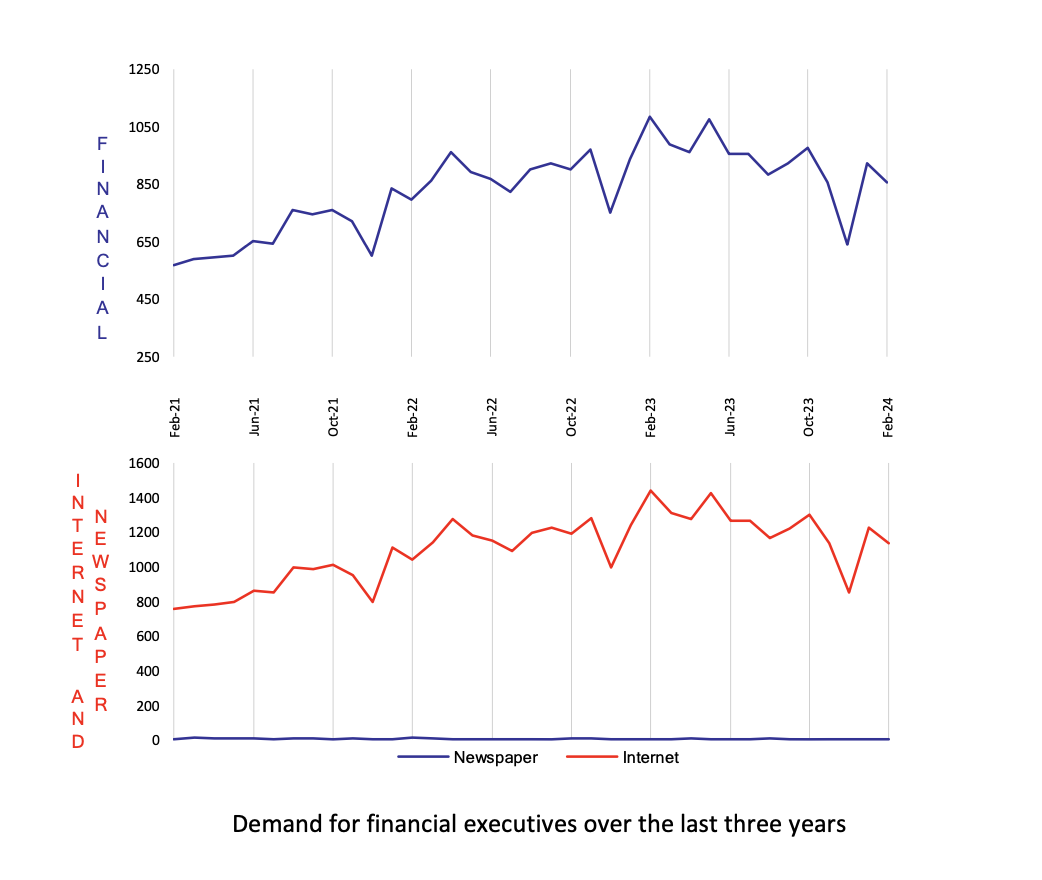
February 2024 E.L Finance Index
February 2024 E.L Finance Index: 857
Same period last year (February 2023): 1083
Percentage change over last month: -7%
Financial positions were down 7 per cent compared to the prior month.
Over the longer term the Finance index has now dropped underneath its medium-term average, but in February the Financial index was the best performing of all the sectors.
Just look at last February to this year compared to last year. A drop of around 25 percent.
In fact this is a relatively good result when compared to the other sectors due to a stronger performance in Queensland. All other states and territories were negative.
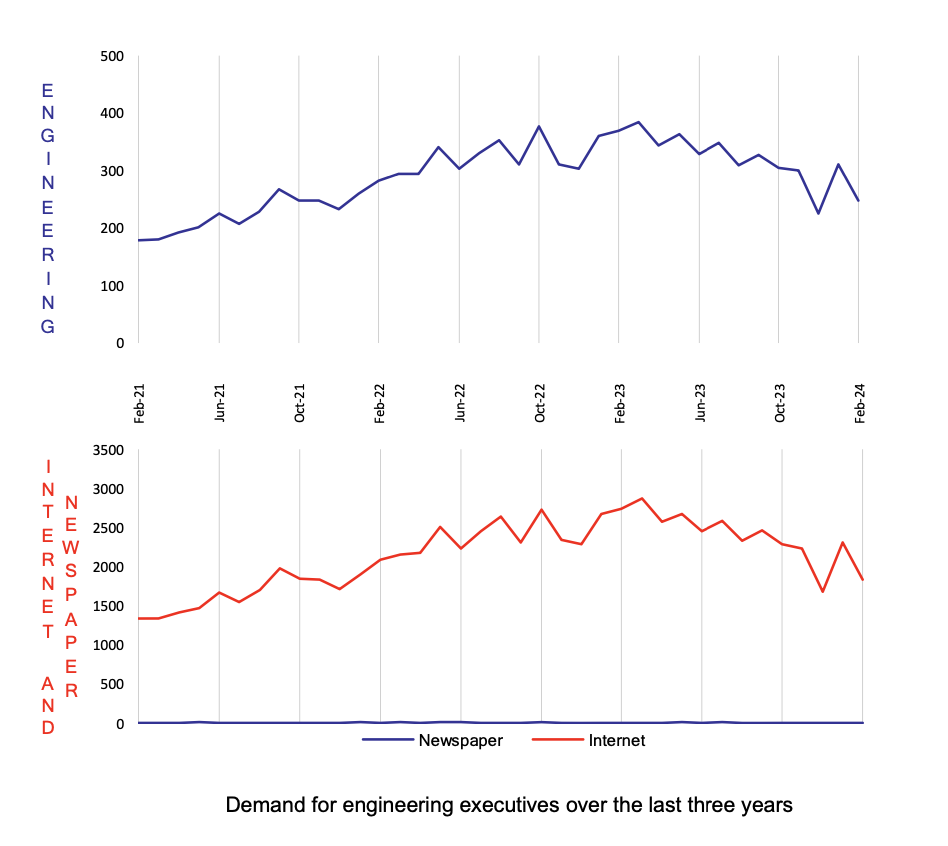
February 2024 E.L Engineering Index
February 2024 E.L Engineering Index: 248
Same period last year (February 2023): 369
Percentage change over last month: -20%
Engineering recorded a 20 per cent fall compared to the prior month, producing a worse than expected result and one that was lower than all the other sectors.
The losses in Engineering mean it has reached levels last seen in 2022, and a long way lower than its most recent high of March 2023.
Evidence is that Engineering positions are struggling to move higher in an environment featuring higher interest rates and higher business costs.
Engineering has a strong correlation to capital investment so clearly employers are not buying new equipment and there is a softening of major infrastructure projects.
The softening of infrastructure development is also due to the huge red tape any major project must now go through to get off the ground.
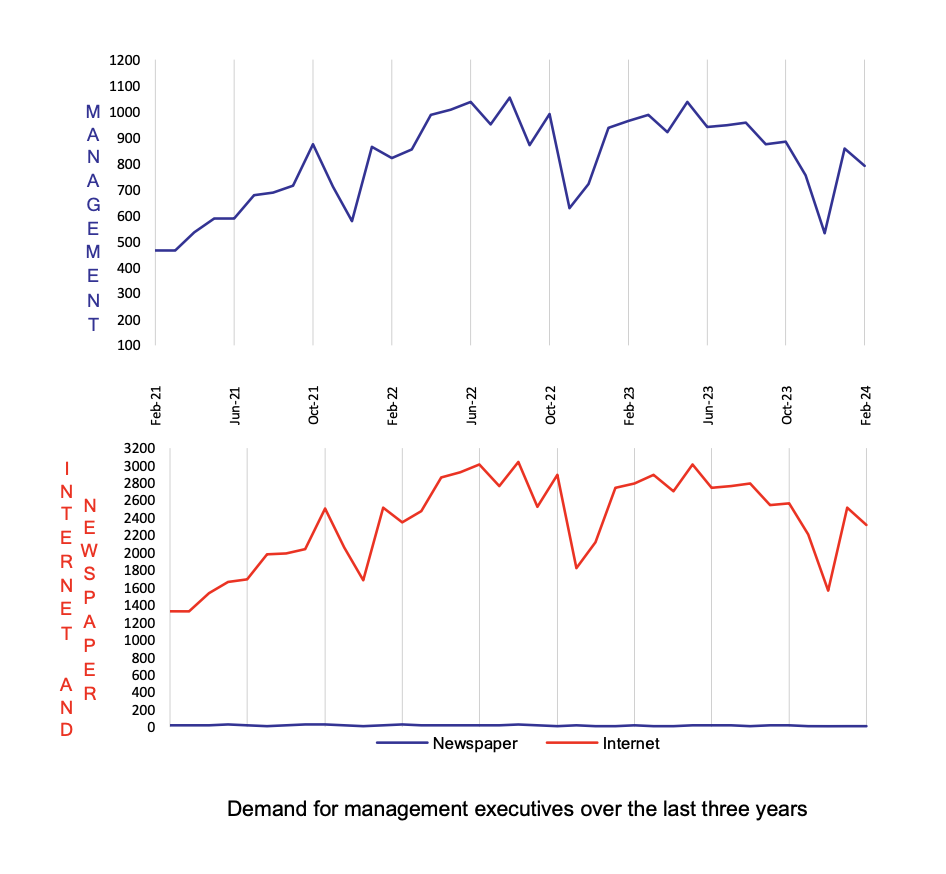
February 2024 E.L Management Index
February 2024 E.L Management Index: 790
Same period last year (February 2023): 963
Percentage change over last month: -8%
The Management sector fell 8 per cent in February compared with the prior month.
Although the result is an overall slight recovery from the end of last year, it has shown a sawtooth result that since 2021 has been either in a flat or negative trend.
In February there were significant losses in South Australia, Northern Territory and Victoria.
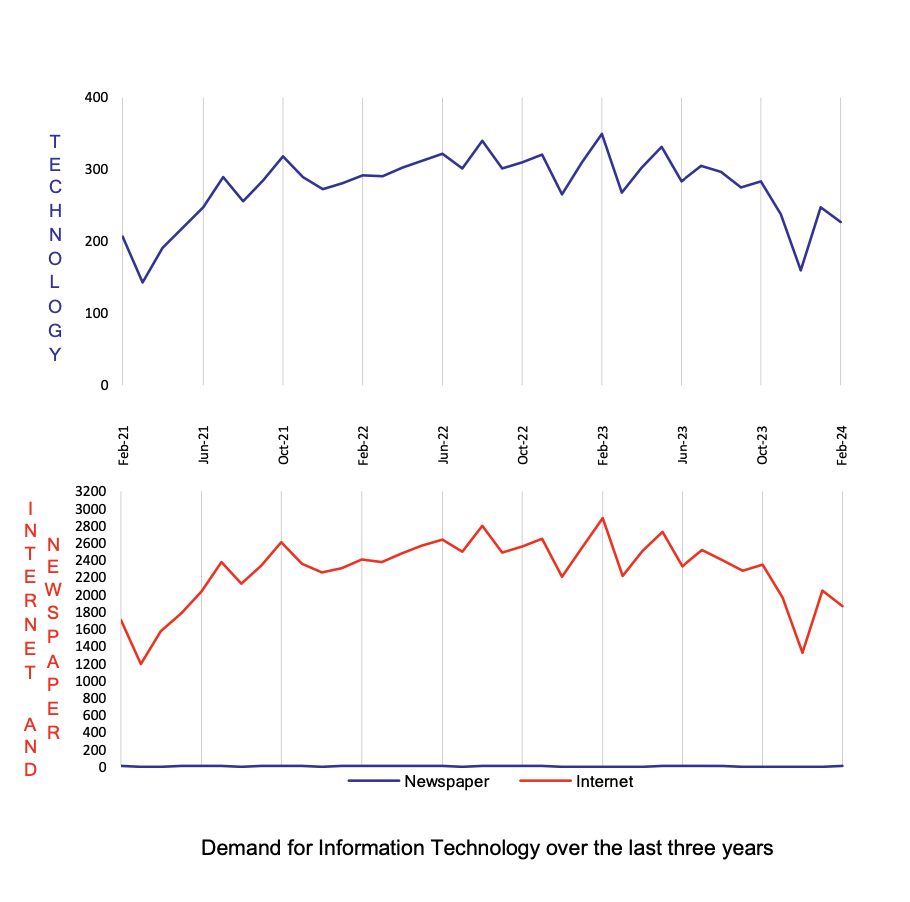
February 2024 E.L Information Technology Index
February 2024 E.L Information Technology Index: 227
Same period last year (February 2023): 349
Percentage change over last month: -8%
Information Technology lost 8 per cent in February. It has now moved 35 per cent lower since this time last year.
The E.L IT index is now back to its levels of early 2021 because the rate of its decline has accelerated since early 2023.
Demand for It people was lower in both the business and government sectors.
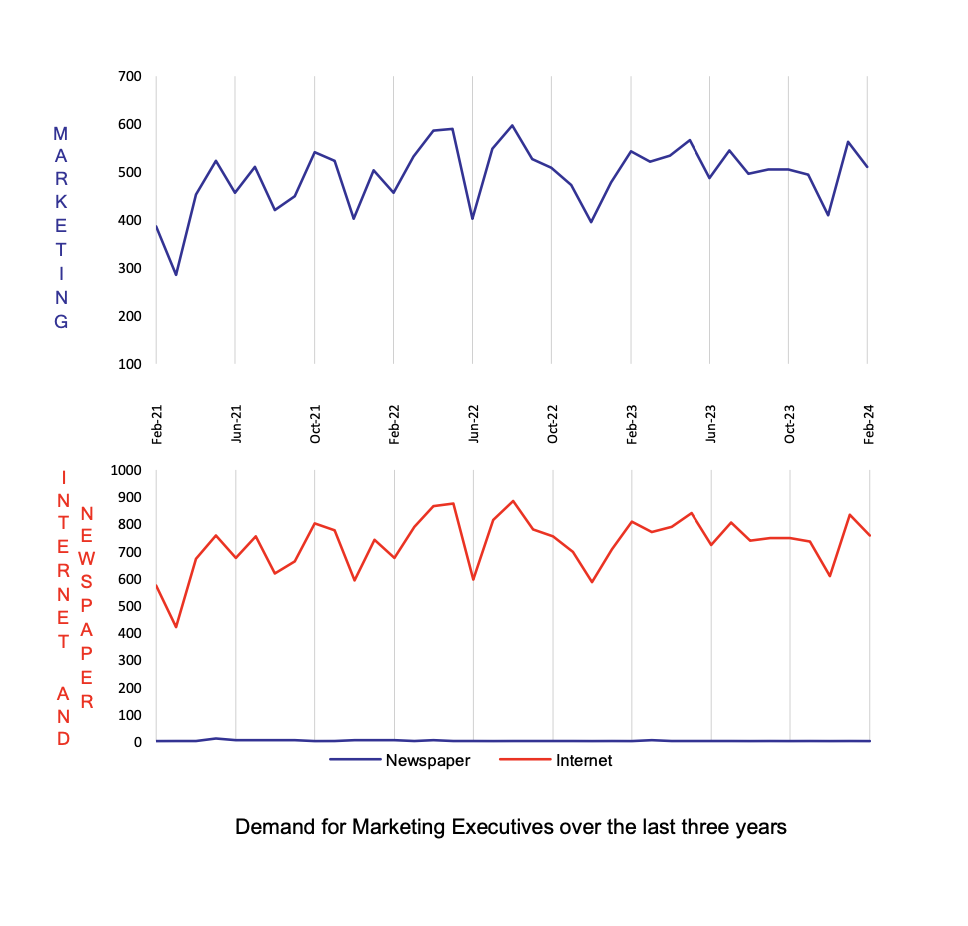
February 2024 E.L Marketing Index
February 2024 E.L Marketing Index: 511
Same period last year (February 2023): 544
Percentage change over last month: -9%
The losses in Marketing over the past year have continued to be relatively flat and in a better position when it comes to trend than the other sectors. The E.L Index dropped 9 per cent over the prior month.
While there was a slight increase in public sector roles all business sector positions fell.
Among the states and regions, Queensland, the ACT and South Australia were higher but this was counteracted by losses in New South Wales and Victoria.
About the E.L Index
The E.L Index is a comprehensive monthly analysis of employment trends at executive level. An Australian analysis is produced in Sydney and an Asian analysis in Hong Kong and Singapore.
The E.L Index has shown by two separate University studies to correlate strongly with general economic and business trends. It is featured by most of the major news services and is closely followed by government and central bank analysts.
The E.L Index is actually a combined national index of all executive demand made up of five separate indices; E.L Finance Index, E.L IT Index, E.L Management Index, E.L Marketing Index and the E.L Engineering Index.
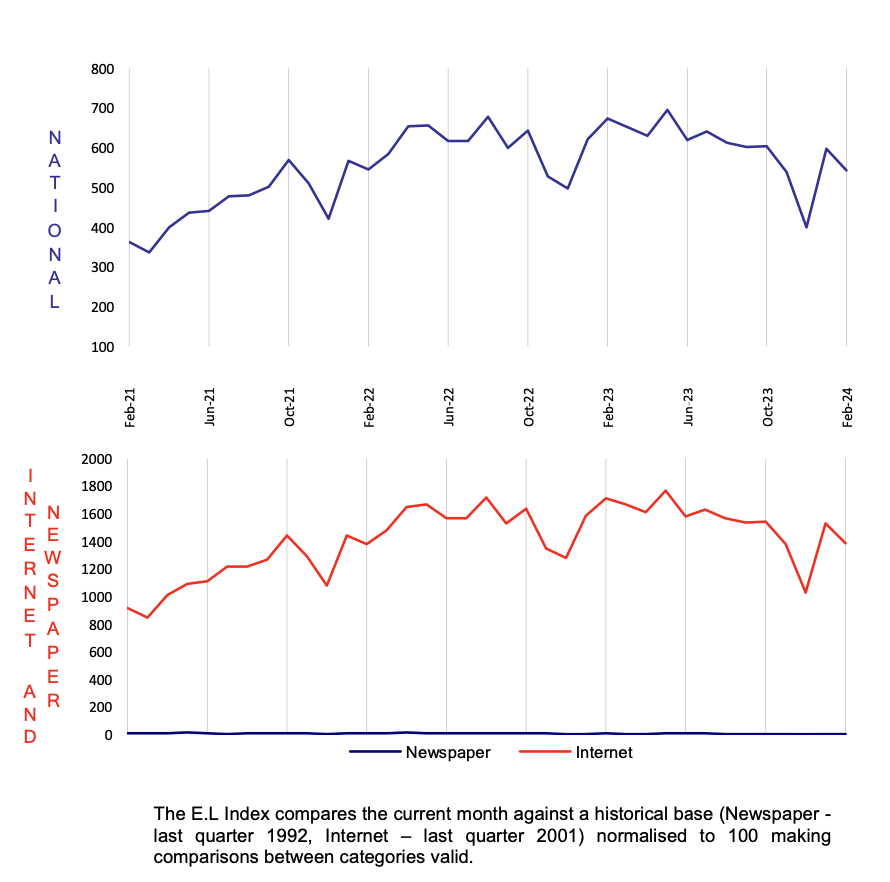
The National and specific career group Indexes are shown as relative indexes recording the monthly demand activity for executive positions in the current month against the demand in a historical base period which is normalised to 100. The historical base period used was the average of the last quarter of 1992 which research showed to be the bottom of that downturn.
By averaging to a historical base period the comparison of, say, June 1994 to June 2000 is meaningful, giving a clean, easily understood appreciation of changing investment and economic trends without seasonal obscurity.
The E.L Index utilises data from both print and internet sources and is the only employment index to do so.
The print data is collected from the major employment paper in each state. National papers are not used to avoid “doubling up”. Internet data is not collected off the web sites which can be subject to some error but instead collected through raw data provided by the ISP themselves. Print data has over 15 years of historical data and the internet more than 6 years.
Why Executive Demand is a Primary Lead Indicator?
It is often claimed that unemployment figures and broad-based job vacancy surveys do not give a fair impression of what is occurring in executive ranks. The E.L Index addresses this and has some interesting correlative and predictive qualities. Such as:
- Employment of management usually precedes the employment of skilled and unskilled workers.
- Employment of engineering executives precedes major capital investment.
- The division between various management sectors gives an indication of which sectors of the economy are experiencing growth or decline.
- Compares month-by-month changes in the public and private sector as well as monitoring government expenditure patterns.
- Makes regional comparisons after allowing for population differences.
- It shows a ‘rate of change’ and can therefore be realistically compared to general economic and employment growth, unlike some surveys that report absolute numbers.
- Core data is collected on an actual expenditure of business and government, not on a respondent’s opinion or confidence level.
