

Businesses keep their belts tightened – while government hiring continues to expand.
Data centre construction now accounts for one dollar in six of all private investment in Australia.
But any profits will likely go offshore.
We are not hiring. Australian business has opened the new financial year with few new jobs. Executive demand is down a further 6 per cent in July, according to the E.L. Executive Demand Index.
Mr Grant Montgomery, Managing Director of E.L Consult, a leading executive search firm that has researched and published the E.L. Executive Demand Index for more than 30 years, said: “July is an important time to measure business confidence, this is the time that budgets are reworked and businesses traditionally plan on who they are going to hire for the coming year.
“This year they have decided to hire almost nobody.
“There is a very uncertain future and the hype around data centre construction which has reached and extraordinary investment level of $8.7 billion in the March quarter alone has not washed onto local businesses” Mr Montgomery said.
“So we are living through the largest sector-specific capital spending boom in a generation and business sector demand for executives went backwards 7 per cent in the month.
“The capital is arriving without the jobs and the profits will depart to offshore accounts through transnational pricing the same way.
“Not that we can blame the data centres. Their money is being invested and their capital that is being risked. But ultimately the profits too will go to low tax offshore accounts made even more attractive now with the latest Federal CGT fiddling.
“In Engineering, the only sector to grow at all – more than half this growth came from government rather than from business hiring which will inevitably lead to even more regulation kicking in.”
“This year only the Engineering sector and Western Australia recorded gains,” Mr Montgomery said.
“So the one part of the executive market that is expanding is being paid for by the taxpayer, while the part that actually pays the taxes is shrinking.
“Of course, all the AI spend is from mostly major international companies and that means the returns will not ultimately end up in Australian hands.
“At least we will get something from the construction jobs’ Montgomery said
“The cheques are signed offshore, the concrete is poured here, the construction efforts end, the money dries up only marginally slower than the concrete and the profits are dispersed low-tax offshore jurisdictions.
Someone in government must realise that our huge taxpayer spend on non-carbon producing power generation will further cost the economy but the idea that you insist on new data centres providing their own green power is totally unrealistic. This is especially since the rest of the world is able to use our cheap coal, gas and uranium.
“Australia gets the construction jobs in the short term and the higher power bills in the longer term.
Western Australia looks a winner.
“The one bright spot is in the west. Western Australia was the only region in the country to add executive positions this month. It remains the state that digs things up, builds things, and is largely left alone to get on with it,” Mr Montgomery said.
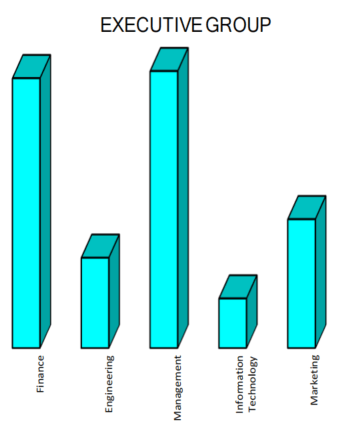
Among the industry groups, Engineering was the only sector to rise, gaining 15 per cent largely on the back of an increase in government sector hiring. Marketing recorded the largest loss at 12 per cent, followed by Management, the Financial sector and Information and Communications Technology.
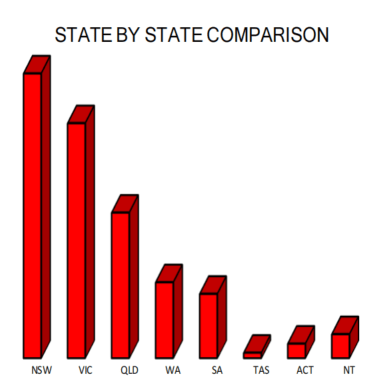
Among the states and territories, Western Australia was the only region to record a gain, rising 3 per cent. New South Wales was comparatively steady at 2 per cent lower, while Victoria fell 12 per cent and Queensland 4 per cent. The ACT recorded the largest retraction at 18 per cent as end-of-financial-year public service spending washed out of the figures.
Email Grant Montgomery on monty@el.au further details
| July 2026 National Index: | 373 |
| Same period last year (July 2025): | 473 |
| Percentage change over last month: | -6% |
National Summary
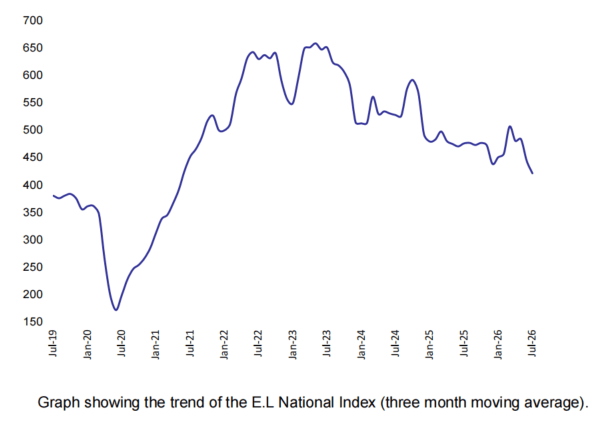
Australian executive demand has had another month of falls despite new financial year budgets becoming available. Executive demand fell a further 6 per cent in July and is now approximately 21 per cent lower than the same period a year ago.
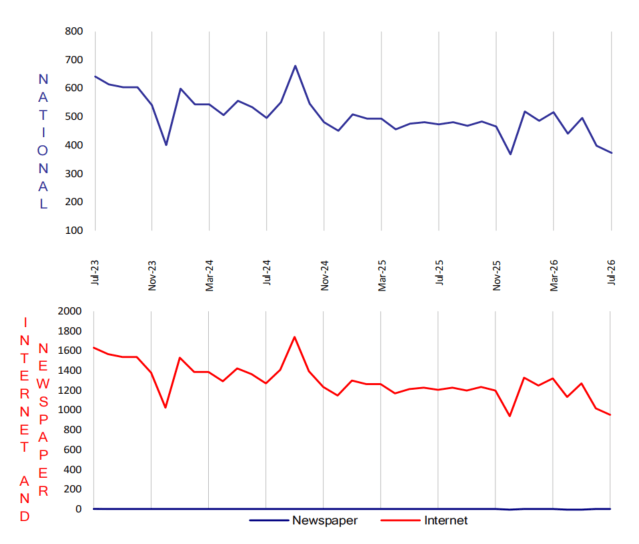

National Demand for Executives over last Seven Years
With the two recent months’ falls the executive demand long-term trend is now clearly below 2021 levels. Apart from holiday-related fillips, the amount of executive jobs has been falling steadily since 2022.
State
Of the two largest states, NSW was comparatively steady with a 2 per cent fall while Victoria dropped 12 per cent.
Queensland, fell 4 per cent. Western Australia was the only region to record a gain, rising 3 per cent. The ACT recorded the largest retraction at 18 per cent.
Executive
All sectors were positive except for private sector management positions. There were significant increases in the financial sector for New South Wales government positions.
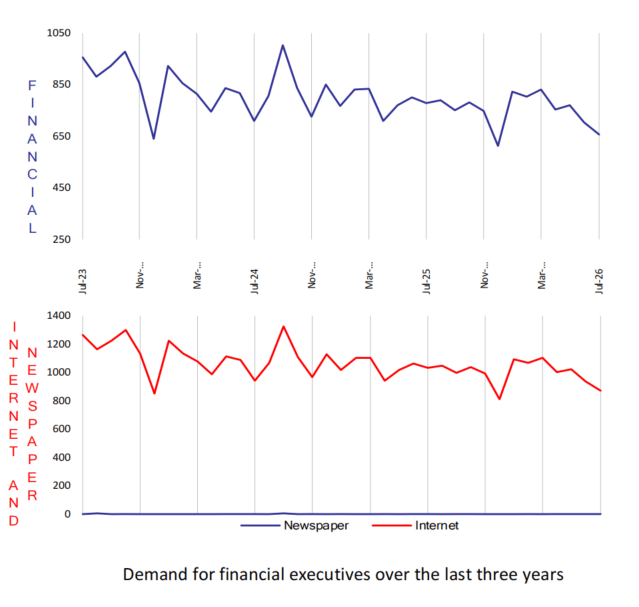
July 2026 E.L Finance Index
| July 2026 E.L Finance Index: | 656 |
| Same period last year (July 2025): | 778 |
| Percentage change over last month: | -7% |
The Financial index fell 7 per cent, giving back the support it drew from end-of-financial-year government hiring in the prior month and resuming the slow decline it has been on since early 2023.
The New South Wales government finance positions that cushioned last month’s result reversed, falling 29 per cent off a small base, while government web-based demand nationally was down 18 per cent. Web-based Business sector positions, which make up the overwhelming bulk of the sector, fell 8 per cent.
South Australia was the only region to record a gain. No Finance positions were advertised in print during the month.

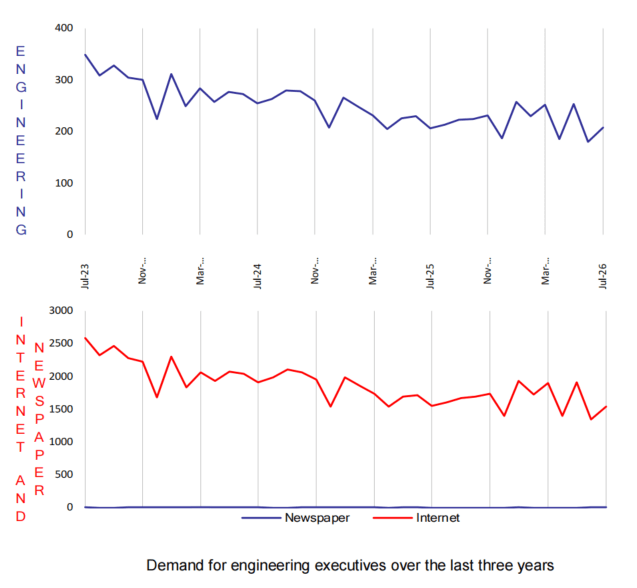
July 2026 E.L Engineering Index
| July 2026 E.L Engineering Index: | 207 |
| Same period last year (July 2025): | 206 |
| Percentage change over last month: | 15% |
Engineering was the only sector to rise, gaining 15 per cent and more than reversing the fall of the prior month. It is the one sector whose longer-term trend has stopped deteriorating, although readings in this index are becoming more volatile month to month.
The gains were broad. Five of the eight regions were higher and the ACT was unchanged. New South Wales and Queensland led among the larger states, both up 18 per cent. Western Australia and Victoria were also stronger and Tasmania higher again off a small base. South Australia and the Northern Territory were the only regions to fall.
Government positions rose sharply, led by New South Wales and Queensland, although from a small base of 34 positions nationally; business sector positions, which account for the bulk of the sector, rose 7 per cent. As Engineering hiring tends to precede capital investment and construction activity, a rise sustained over coming months would be an encouraging signal for the wider economy.

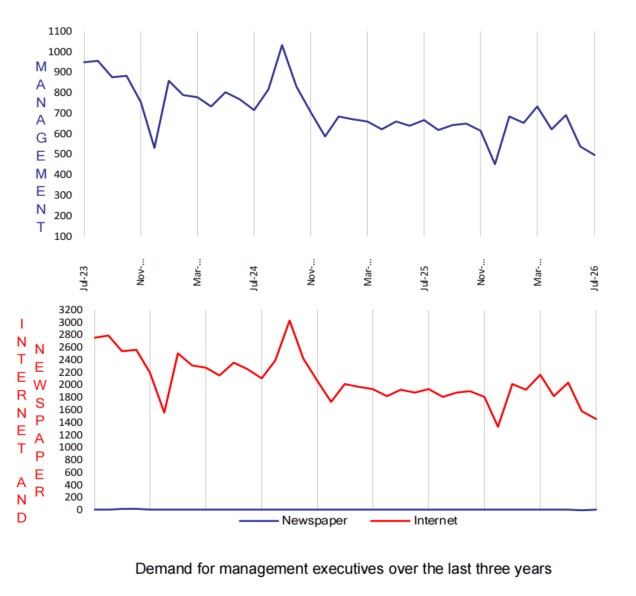
July 2026 E.L Management Index
| July 2026 E.L Management Index:: | 497 |
|
Same period last year (July 2025): |
668 |
| Percentage change over last month: | -8% |
Management fell 8 per cent. It remains the largest sector by volume, but after a relatively stable 2024/25 financial year, the losses that began in 2022 continue with little sign of a floor.
Victoria provided most of the ballast with a 22 per cent fall, while South Australia was also sharply lower. New South Wales was comparatively steady at 3 per cent lower, while Western Australia, Queensland and the ACT recorded gains, as did the small bases of the Northern Territory and Tasmania.
The fall was a business sector story. Business positions fell 8 per cent while government demand was broadly steady. The persistent gap between the two continues to point to a hollowing out of management roles in the business sector at a time when government employment of managers is holding up or expanding.

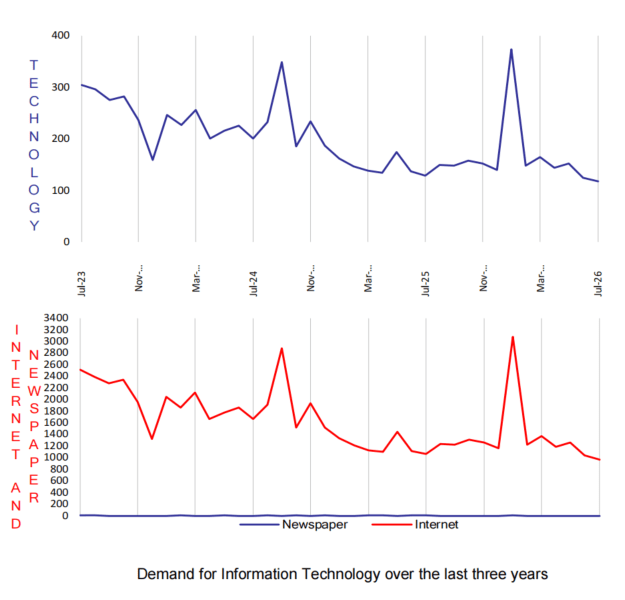
July 2026 E.L Information Technology Index
| July 2026 E.L Information Technology Index: | 117 |
| Same period last year (July 2025): | 129 |
| Percentage change over last month: | -6% |
Information and Communications Technology fell 6 per cent. Despite the significant amounts of spend on data centres and associated technology, this is not translating into positions in the local market.
Queensland and the ACT were the only regions to rise. Victoria recorded the largest fall among the larger states. New South Wales, Western Australia and the smaller regions were also lower.
Interestingly, in 2024 and 2025 the July start of the new financial year brought gains in demand whereas this year has brought little respite from demand reductions. The sawtooth pattern of recent years seems to have been replaced by a moribund lack of interest in employing new executives in the sector.

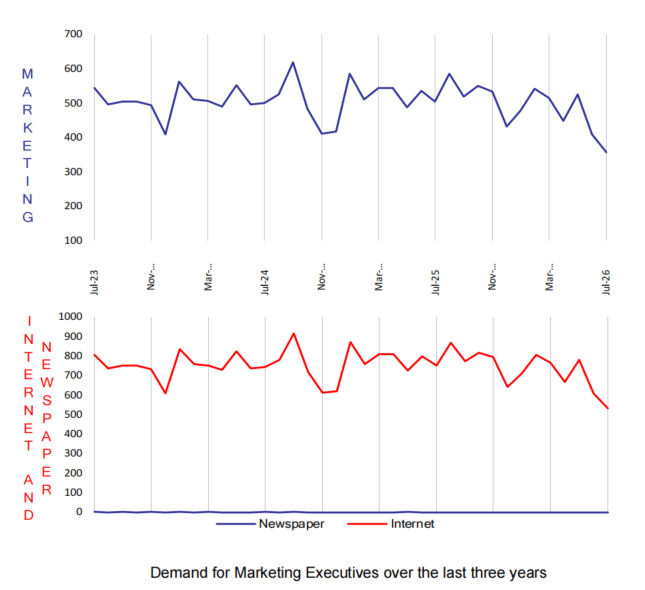
July 2026 E.L Marketing Index
| July 2026 E.L Marketing Index: | 358 |
| Same period last year (July 2025): | 505 |
| Percentage change over last month: | -12% |
Marketing was the weakest sector of the month, falling 12 per cent. The relative resilience that made it the standout performer through the post-Covid period has now clearly broken as it is now trading well below its recent range.
The losses were widespread. Queensland, South Australia and Western Australia were all sharply lower and New South Wales fell 10 per cent, while Victoria was the most resilient of the larger states at 3 per cent lower. Among the small regions Tasmania recorded no Marketing positions at all and the ACT fell 67 per cent.
Having been among the more resilient sectors through 2025, its sustained retreat this year suggests companies are still trimming discretionary and customer-facing roles.

About the E.L Index
The E.L Index is a comprehensive monthly analysis of employment trends at executive level. An Australian analysis is produced in Sydney and an Asian analysis in Hong Kong and Singapore.
The E.L Index has shown by two separate University studies to correlate strongly with general economic and business trends. It is featured by most of the major news services and is closely followed by government and central bank analysts.
The E.L Index is actually a combined national index of all executive demand made up of five separate indices; E.L Finance Index, E.L IT Index, E.L Management Index, E.L Marketing Index and the E.L Engineering Index.
The National and specific career group Indexes are shown as relative indexes recording the monthly demand activity for executive positions in the current month against the demand in a historical base period which is normalised to 100. The historical base period used was the average of the last quarter of 1992 which research showed to be the bottom of that downturn.
By averaging to a historical base period the comparison of, say, June 1994 to June 2000 is meaningful, giving a clean, easily understood appreciation of changing investment and economic trends without seasonal obscurity.
The E.L Index utilises data from both print and internet sources and is the only employment index to do so.
The print data is collected from the major employment paper in each state. National papers are not used to avoid “doubling up”. Internet data is not collected off the web sites which can be subject to some error but instead collected through raw data provided by the ISP themselves. Print data has over 15 years of historical data and the internet more than 6 years.
Why Executive Demand is a Primary Lead Indicator?
It is often claimed that unemployment figures and broad-based job vacancy surveys do not give a fair impression of what is occurring in executive ranks. The E.L Index addresses this and has some interesting correlative and predictive qualities. Such as:
- Employment of management usually precedes the employment of skilled and unskilled workers.
- Employment of engineering executives precedes major capital investment.
- The division between various management sectors gives an indication of which sectors of the economy are experiencing growth or decline.
- Compares month by month changes in the public and private sector as well as monitoring government expenditure patterns.
- Makes regional comparisons after allowing for population differences.
- It shows a ‘rate of change’ and can therefore be realistically compared to general economic and employment growth unlike some surveys that report absolute numbers.
- Core data is collected on an actual expenditure of business and government, not on a respondent’s opinion or confidence level.