

A quarter of Australian Executive positions lost in last four months
Public sector jobs remain resilient as Australia’s productivity crisis deepens.
Australian executives have seen demand for their services fall by about a quarter over the four months since the announcement of the Federal Government’s taxation changes, according to the E.L. Executive Demand Index.
Mr Grant Montgomery, Managing Director of leading executive search firm, E.L Consult, said: “The demand for executives in Australia has fallen by 25.2 per cent over the last quarter.”
The E.L. Executive Demand Index has been researched and published by E.L Consult for 30 years.
“Virtually all of the decrease has come from the business sector, with government sector executive employment only dropping slightly over the same period” Mr Montgomery said.
“We need to look behind the political spin on the strength of the Australian economy and examine the underlying facts which show some massively falling productivity and increasing debt.
“inflation remains above the Reserve Bank’s inflation band so interest rates – already at global highs – are likely to go much higher.
“GDP grew 0.3 per cent in the March quarter, down from 0.9 per cent, and growth is expected to remain low through the rest of 2026,” Mr Montgomery said.
The E.L Index remained flat in August compared to the prior month.
“The flat result is not significant in isolation, unless of course you are unemployed, but it is indicative of the business sector sitting on their hands when it comes to new investment and recruitment decisions.
Originally, I think’ there was an expectation that the ridiculous budgetary changes would be softened and changed,” Mr Montgomery said.
“What began as a shock has developed into disbelieve that the government was so committed to a socialist agenda that it did not see the fine balance of investment and taxation and the effect any changes will have on the overall Australian economy.
“Even now the few changes of the new taxes have been minor administrative fixes and do nothing to suggest there is any understanding of how the Australian economy works.
“We are largely an innovative economy of small business employers that work on aspiration. Wealth cannot be driven higher by uncontrolled government spending.
“The longer-term picture is no better for either business or workers,” Mr Montgomery said.
“In the approximate four years from December 2021 our real wages fell 2.6%, and in the period from March 2020 to September 2025 Australia’s real wage growth came in at 23rd out of 31 developed countries – below the UK and just above Greece.
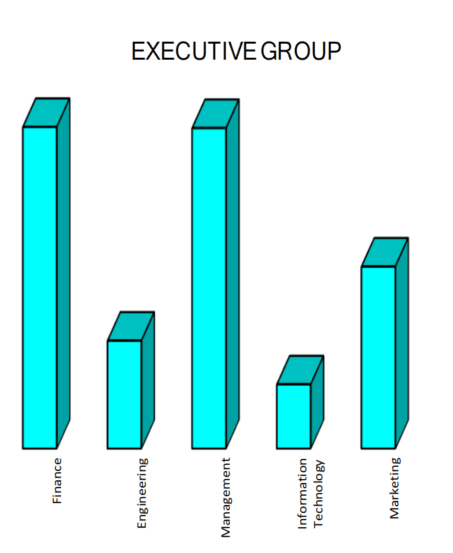
Among the industry groups in August, Marketing and Information Technology saw some gains after poor months prior but were offset by falls in all other sectors. Continuing its recent run, Management produced the largest fall.
“Management has lost a third of positions in the past four months, followed by Marketing at approximately 21 per cent. The Financial sector has been the least buffeted as this sector is more required for baseline regulatory business compliance,” Mr Montgomery said.
“Disturbingly, over 99 per cent of the positions lost were in the business sector.
“Government belt-tightening has produced a single digit percentage reduction in bureaucracy demand over the same period.
“This is a basic problem – the taxpayers are cutting back, while those that depend on taxes to pay their wages are retaining their numbers.
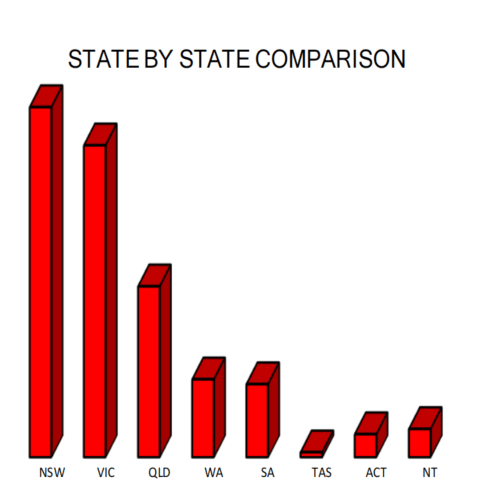
Among the states and territories, Victoria, New South Wales and the ACT moved ahead. These movements were offset by significant negative movements among the other regions.
“Victoria has recorded a 8 percent increase this month but overall demand for executives remains in the doldrums with a massive 25 percent drop over the previous quarter. Perhaps the government is trying to boost some employment nubers before it goes into caretaker mode ” Mr Montgomery said.
Contact Grant Montgomery on monty@el.au for further information
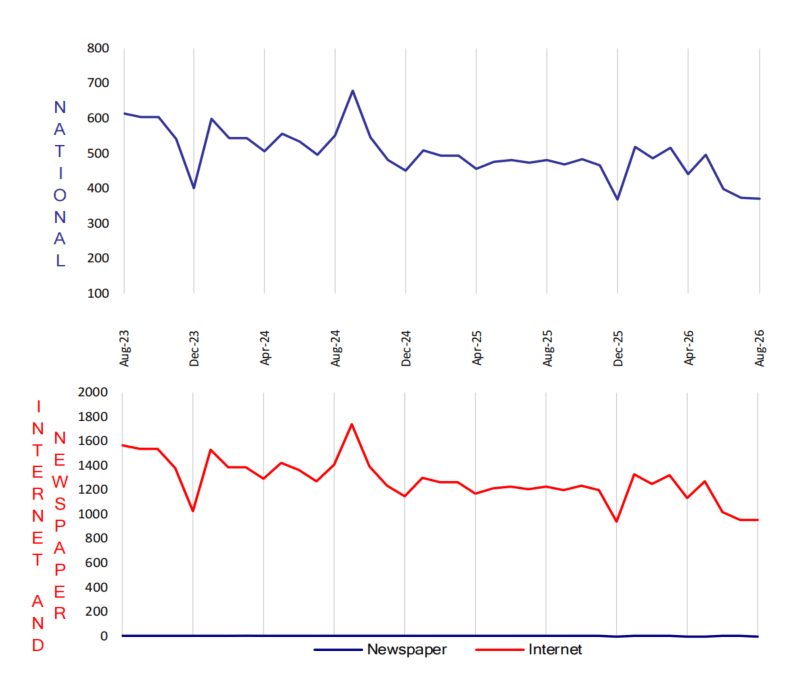
| August 2026 National Index: | 371 |
| Same period last year (August 2025): | 480 |
| Percentage change over last month: | 0 |
National Summary
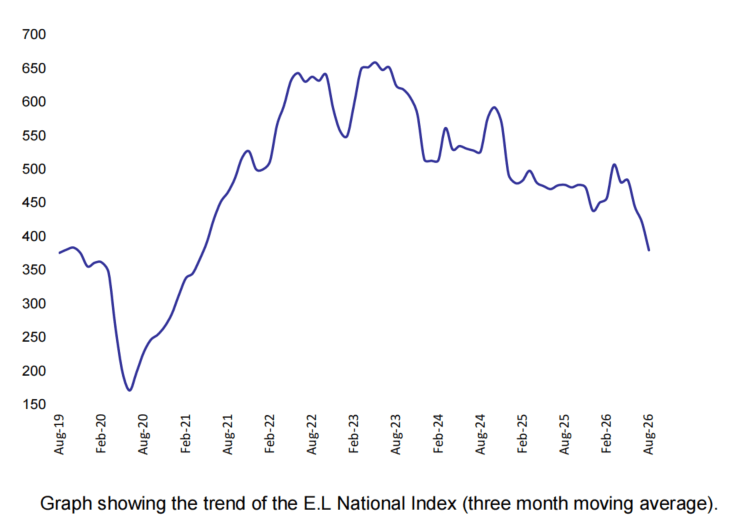
Australian executives have seen demand for their services fall by approximately a quarter in the past four months.
This exemplifies the uncertainty buffeting the Australian economy since the announcement of significant planned investment taxation law amendments.
The E.L Index was unchanged in August compared to July .

National Demand for Executives over last Seven Years
The fall off since February high lights the scale of the decline. Demand is now well below its recent range.
Apart from some short-lived holiday related business demand executive demand has been falling steadily since 2022.
State
Victoria led the country with an 8 per cent gain and New South Wales edged up 1 per cent. The ACT rose 29 per cent off a small base. Every other region fell. Tasmania dropped 26 per cent, Western Australia 17 per cent, South Australia 8 per cent, Queensland 5 per cent and the Northern Territory 4 per cent.
Executive
Marketing and Information Technology saw some gains after poor months prior but were offset by falls in all other sectors. Continuing its recent run, Management produced the largest fall, having now suffered a loss of a third of its positions in the past four months.
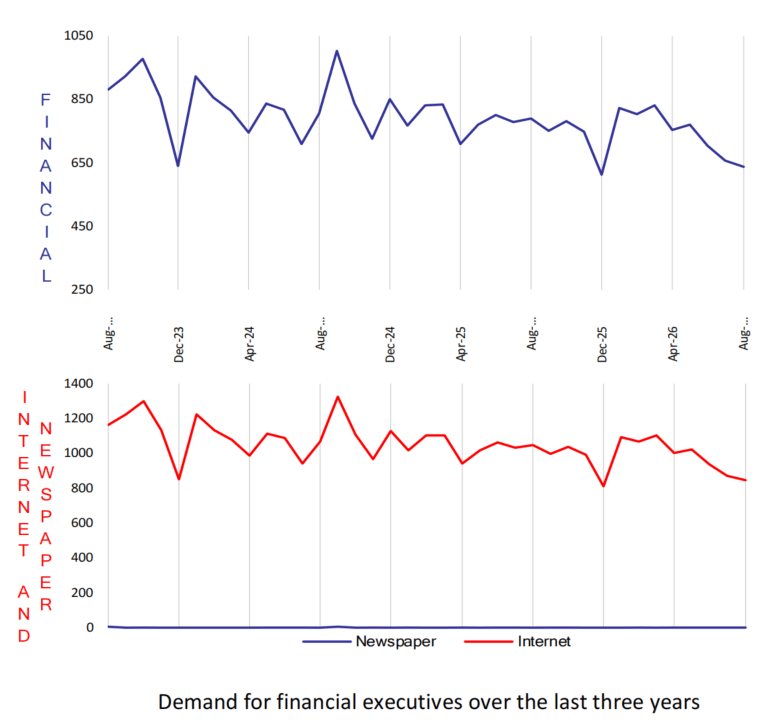
August 2026 E.L Finance Index
| August 2026 E.L Finance Index: | 637 |
| Same period last year (August 2025): | 788 |
| Percentage change over last month: | -3% |
The Financial index fell 3 per cent, extending the slow decline it has been on since early 2023.
Queensland and Victoria gained some ground among the larger states, with the ACT higher off a small base (same as in all sectors this report). Those gains were outweighed by New South Wales and South Australia. Western Australia and the Northern Territory were also lower.
Government positions held steady nationally. The fall came from the business sector which supplies the overwhelming bulk of the sector.

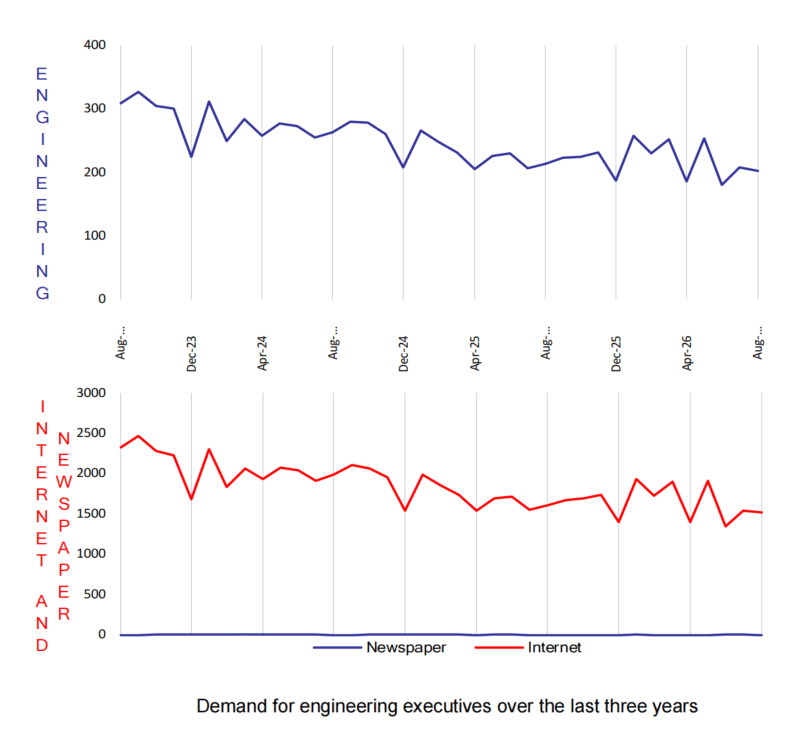
August 2026 E.L Engineering Index
| August 2026 E.L Engineering Index: | 201 |
| Same period last year (August 2025): | 214 |
| Percentage change over last month: | -3% |
ngineering fell 3 per cent, giving back part of the gain it made in July. The reversal came from the government sector, where positions fell nationally. Business sector demand rose slimly over the same period.
Most regions were slightly weaker. Western Australia and Queensland were lower, while New South Wales and Victoria were close to flat. South Australia and the ACT were the only regions to gain.
After an extremely bumpy last few months, it is clear that Engineering has lost ground since 2025.

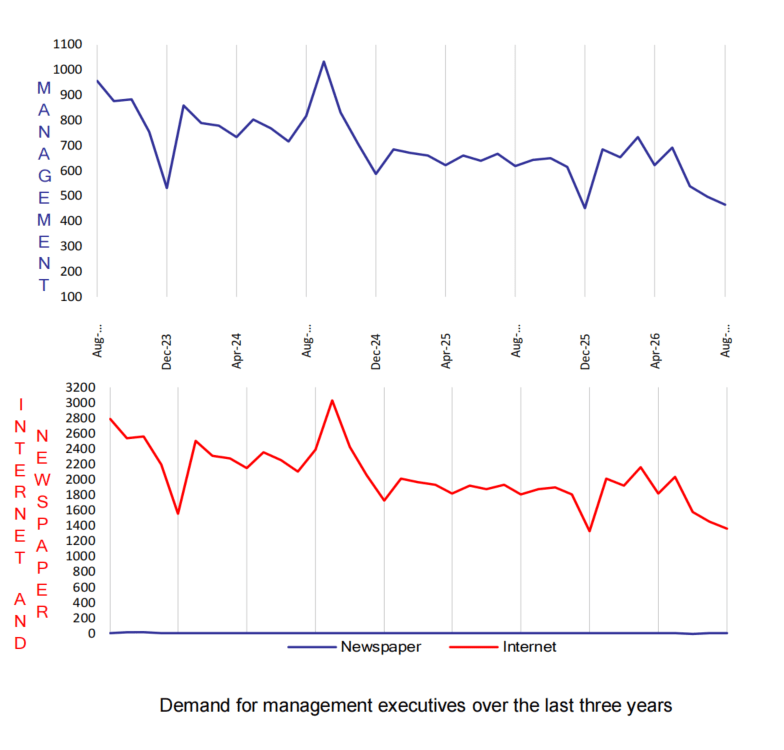
August 2026 E.L Management Index
| August 2026 E.L Management Index:: | 464 |
| Same period last year (August 2025): | 620 |
| Percentage change over last month: | -7% |
Management fell 7 per cent, the largest fall of any group. It has now lost a third of its positions since May, though it remains the largest sector by volume.
Western Australia and Queensland provided the mainstay of the negative impetus, followed by New South Wales. However, Victoria, ACT and South Australia each rose..
ACT’s propulsion was provided by a 55 per cent increase in the amount of government sector positions advertised compared to the prior month – a prodigious increase given the reduction in positions in the business community.

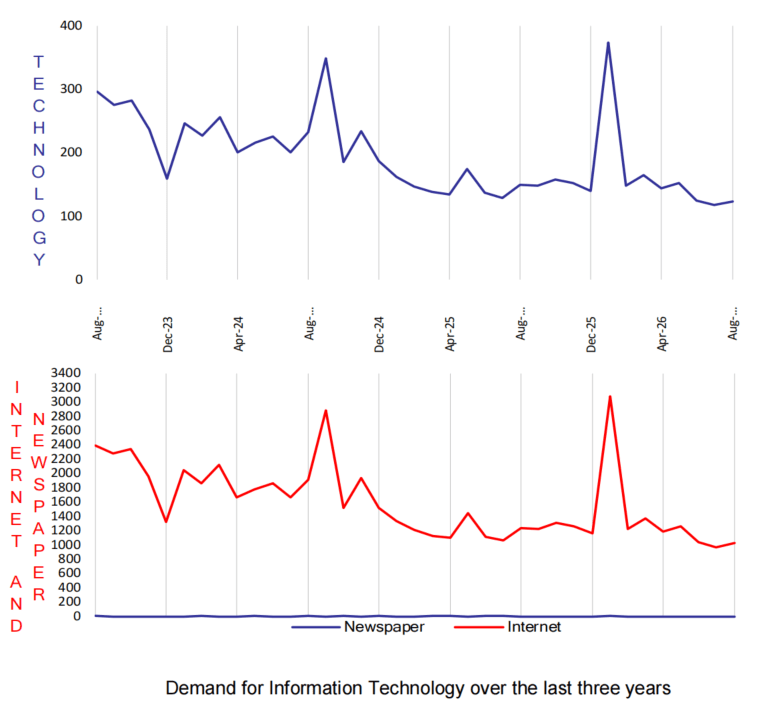
August 2026 E.L Information Technology Index
| August 2026 E.L Information Technology Index: | 124 |
| Same period last year (August 2025): | 150 |
| Percentage change over last month: | 6% |
Information and Communications Technology rose 6 per cent compared to the prior month.
The ACT again led the way in terms of demand increases, followed by Queensland and Victoria. New South Wales and Western Australia were lower.
Despite the scale of national spending on data centres and associated technology, that investment is seemingly not translating into executive positions in the local market.

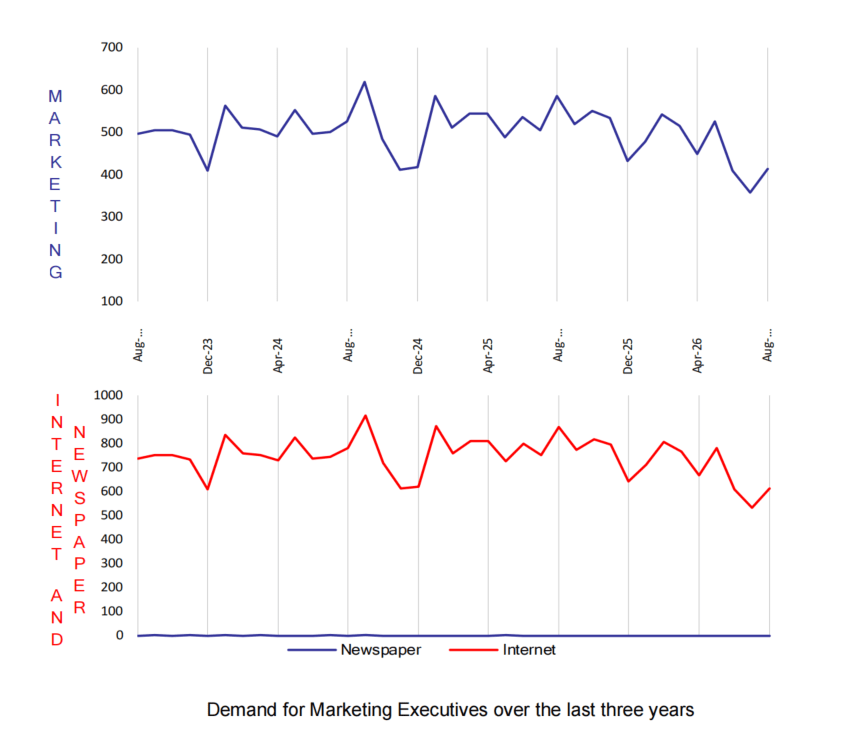
August 2026 E.L Marketing Index
| August 2026 E.L Marketing Index: | 413 |
| Same period last year (August 2025): | 585 |
| Percentage change over last month: | 15% |
Marketing was the strongest sector of the month, rising 15 per cent and recovering the ground it lost in July.
New South Wales picked up a 25 per cent increase, followed by Victoria and Queensland. Losses in South Australia and Western Australia were not enough to push the overall index into negative territory.
The gain was almost entirely a business sector story. Government marketing demand fell to a single position nationally, continuing a run of near-absence from this sector.

About the E.L Index
The E.L Index is a comprehensive monthly analysis of employment trends at executive level. An Australian analysis is produced in Sydney and an Asian analysis in Hong Kong and Singapore.
The E.L Index has shown by two separate University studies to correlate strongly with general economic and business trends. It is featured by most of the major news services and is closely followed by government and central bank analysts.
The E.L Index is actually a combined national index of all executive demand made up of five separate indices; E.L Finance Index, E.L IT Index, E.L Management Index, E.L Marketing Index and the E.L Engineering Index.
The National and specific career group Indexes are shown as relative indexes recording the monthly demand activity for executive positions in the current month against the demand in a historical base period which is normalised to 100. The historical base period used was the average of the last quarter of 1992 which research showed to be the bottom of that downturn.
By averaging to a historical base period the comparison of, say, June 1994 to June 2000 is meaningful, giving a clean, easily understood appreciation of changing investment and economic trends without seasonal obscurity.
The E.L Index utilises data from both print and internet sources and is the only employment index to do so.
The print data is collected from the major employment paper in each state. National papers are not used to avoid “doubling up”. Internet data is not collected off the web sites which can be subject to some error but instead collected through raw data provided by the ISP themselves. Print data has over 15 years of historical data and the internet more than 6 years.
Why Executive Demand is a primarily lead indicator?
It is often claimed that unemployment figures and broad-based job vacancy surveys do not give a fair impression of what is occurring in executive ranks. The E.L Index addresses this and has some interesting correlative and predictive qualities. Such as:
- Employment of management usually precedes the employment of skilled and unskilled workers.
- Employment of engineering executives precedes major capital investment.
- The division between various management sectors gives an indication of which sectors of the economy are experiencing growth or decline.
- Compares month by month changes in the public and private sector as well as monitoring government expenditure patterns.
- Makes regional comparisons after allowing for population differences.
- It shows a ‘rate of change’ and can therefore be realistically compared to general economic and employment growth unlike some surveys that report absolute numbers.
- Core data is collected on an actual expenditure of business and government, not on a respondent’s opinion or confidence level.