

Demand for Executive Positions in Australia in December 2023
Demand for executive positions in Australia had its largest fall in 6 months according to E.L. Index, a monthly report on the availability of jobs for middle Australia.
Mr Grant Montgomery, Managing Director of the E.L Group a leading HR consulting firm said,
“As we have been predicting for some time the employment market, particularly for middle Australian executive positions, is dour and getting worse. This month it is just about in free fall.”
“It’s the largest fall in jobs in 6 months after continual declines for the last financial year,” He said.
“The level of executive demand fell by 11 per cent in November.”
Why has the Demand for Executive Positions Continued to Decline?
“Unfortunately this executive job sector is the part of society most affected by the rising interest rates.”
“They are middle Australia who mostly have an office job designated ‘executive’ and could be working in either the government or private sector.”
“This group is most likely to have a mortgage and be heavily impacted by RBA interest rate increases.”
“These people are most likely to be on a salary with little flexibility – like being able to get overtime or work two jobs.”
“They bear the full brunt of the RBA interest rates and now from the falling E.L index, it is evident it will get harder and harder for them to get jobs.”
Our Advice & Prediction for 2024 Executive Employment Trend
“Best advice right now is if you have a job stay put.”
“Remembering that the E.L Index is a lead index – it shows trends before they show up elsewhere – we are probably going to see some recessionary trends with higher unemployment occurring about March 2024 onwards.”
“There is little doubt that Christmas spending will be reduced this year.”
“The cash rate now sits at 4.35 per cent after the RBA held last month’s rate and there will be no change until February 2024 when the board meets again.”
Hopefully, the cost of mortgages will finally create enough pressure on inflation to stop Governor Bullock from pushing rates up again in the new year.
“The RBA is aiming to have inflation around 2 to 3 percent but doesn’t think inflation will come into this target band until the end of 2025.”
“On the positive side, interest rates in Europe and the US seem to be on a decline, and this trend could start to flow on here as prices on energy like oil decline,” Mr Montgomery said.
In November, among the states, the results were mostly lower. The only higher states/ territories were Tasmania and the ACT, while New South Wales and Victoria were sharply lower, with Western Australia and Queensland also lower.
Demand decreased across all executive sectors during the month, particularly Financial, Management and Information Technology, with web-based private sector results particularly on the decline.
Call Grant Montgomery on +612 9221 6688 or 0414926688 for further details
November 2023 Statistics
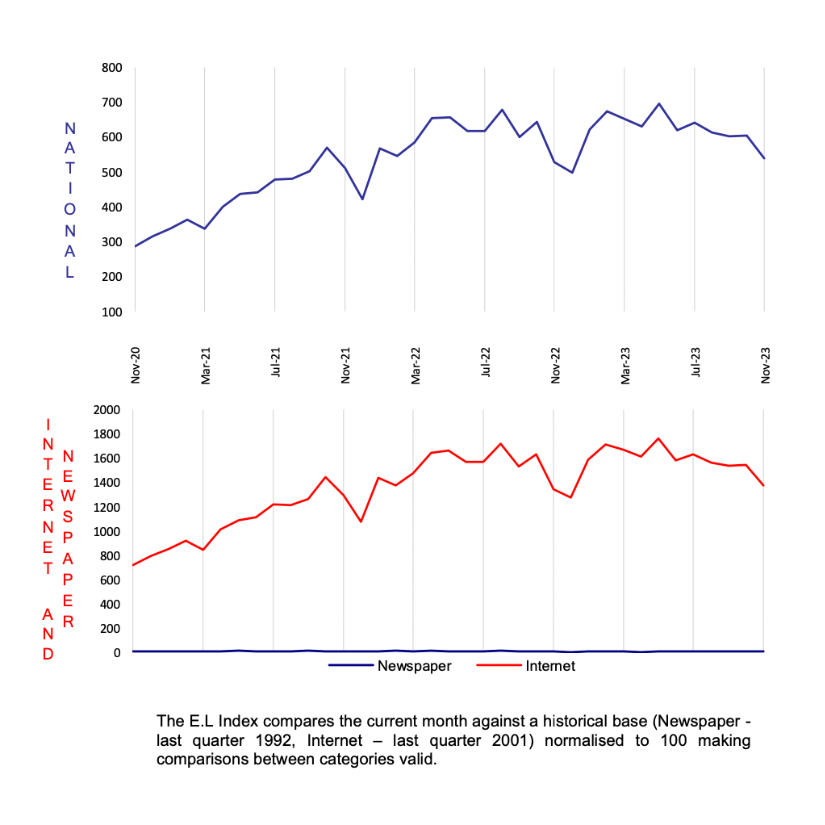
November 2023 National Index
November 2023 National Index: 541
Same period last year (November 2022): 530
Percentage change over last month: -11%
National Summary
Demand for Australian executives has fallen the most in 6 months, according to the E.L. Executive Demand Index. As we have been predicting the employment of executive level people is in free fall. It is the largest fall in jobs in 6 months after continual declines this financial year.
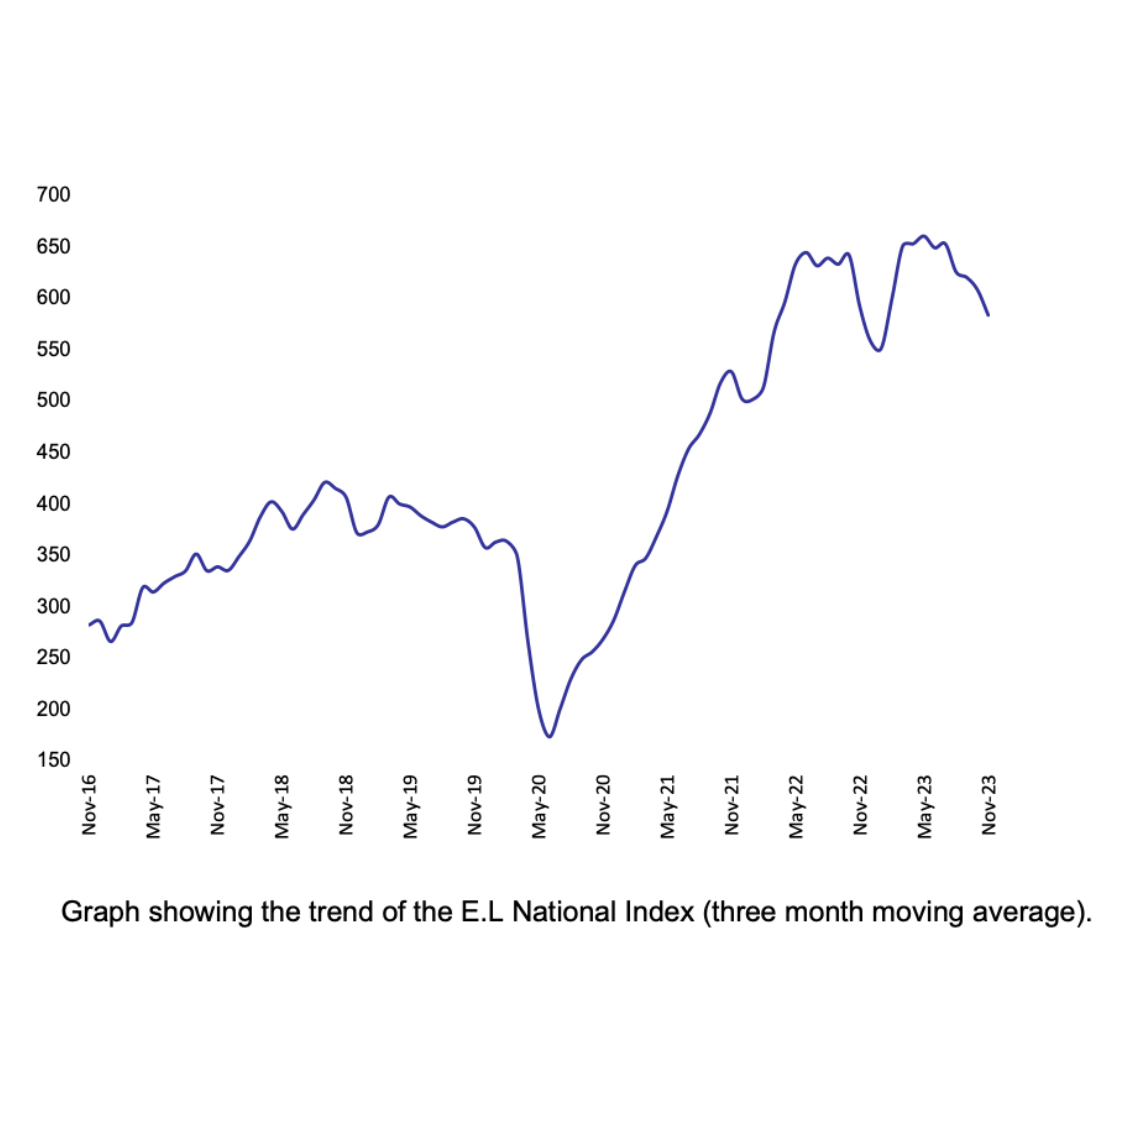
National Demand for Executives Over Last Seven Years
The three-monthly trend figure has moved lower than its recent trading range and is clearly on the downturn thanks to recent losses.
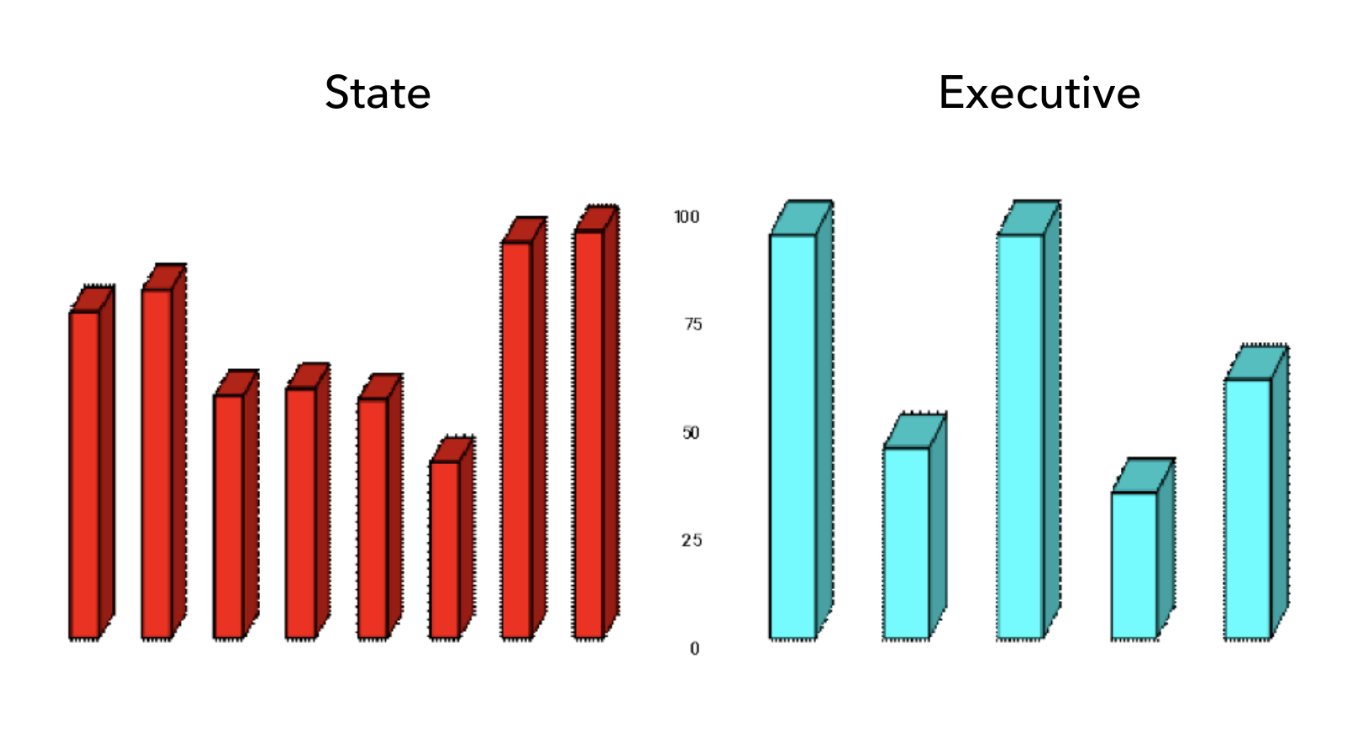
State
Strong performances out of NSW and Victoria allowed the overall positive result despite some small losses in the other states. In particular, gains in the Finance positions in NSW and Engineering in Victoria. Apart from South Australia, which showed gains in all sectors except Marketing, the smaller states and territories experienced slight falls.
Executive
All sectors were positive except for private sector management positions. There were significant increases in the financial sector for New South Wales government positions. Other significant gains included the Tasmanian and ACT Marketing. (no doubt pushed up by their resources sector)
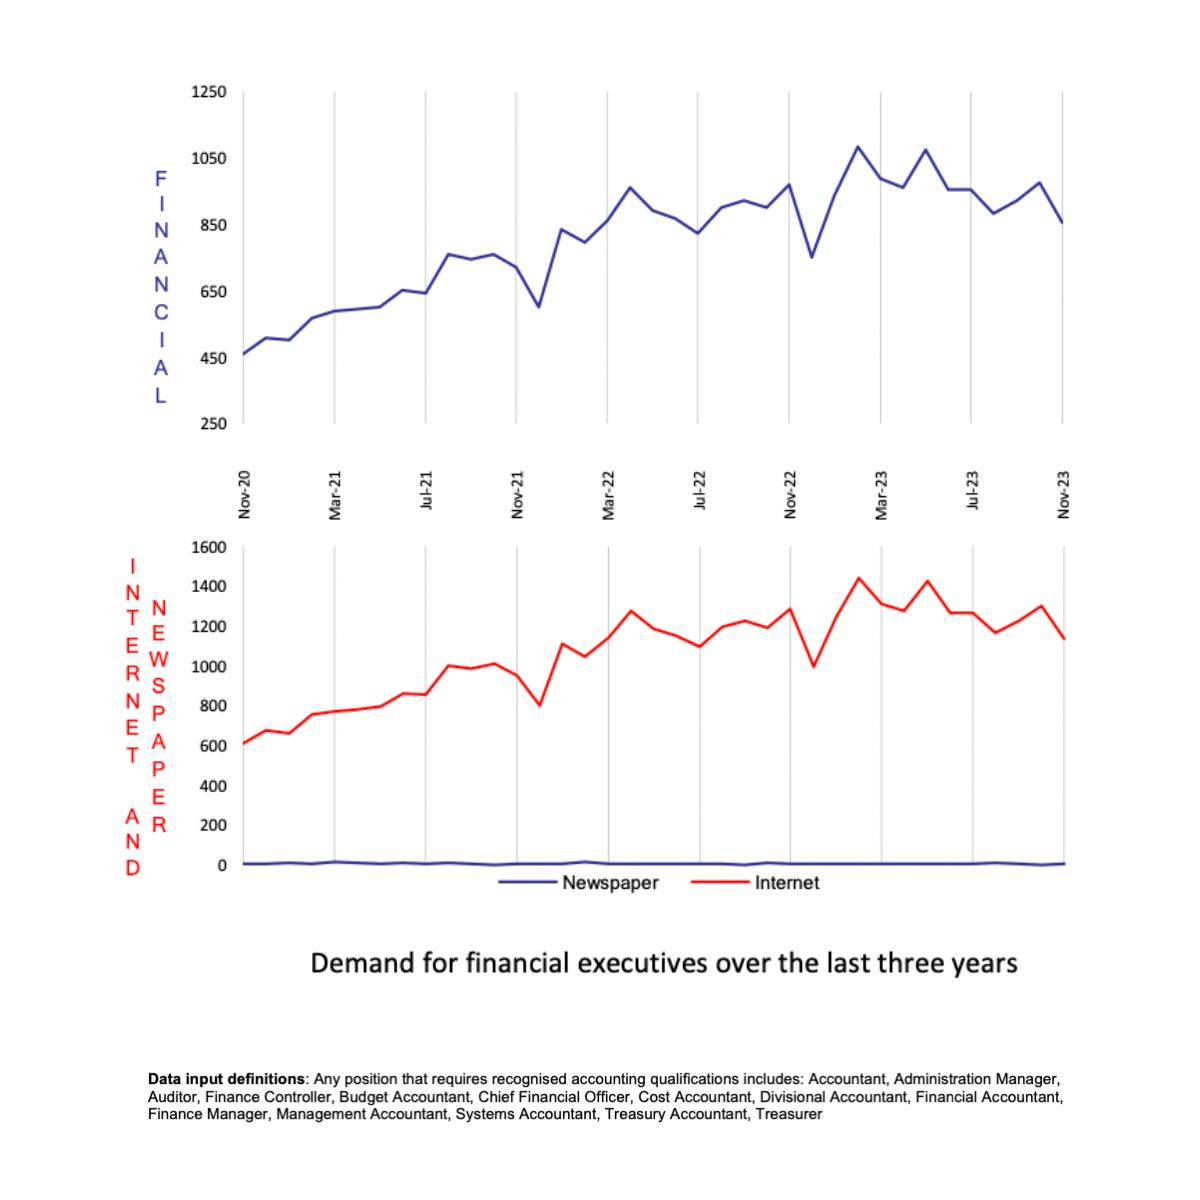
November 2023 E.L Finance Index
November 2023 E.L Finance Index: 855
Same period last year (November 2022): 969
Percentage change over last month: -13%
Financial positions were down 13 per cent compared to the prior month. Over the longer term, the Finance index has dropped below its medium-term average.
The only state and territory to produce a sizeable gain was the ACT, with losses concentrated in the larger states of New South Wales, Queensland and Victoria.
Notably, Finance jobs have decreased in times of trouble and increased interest rates.
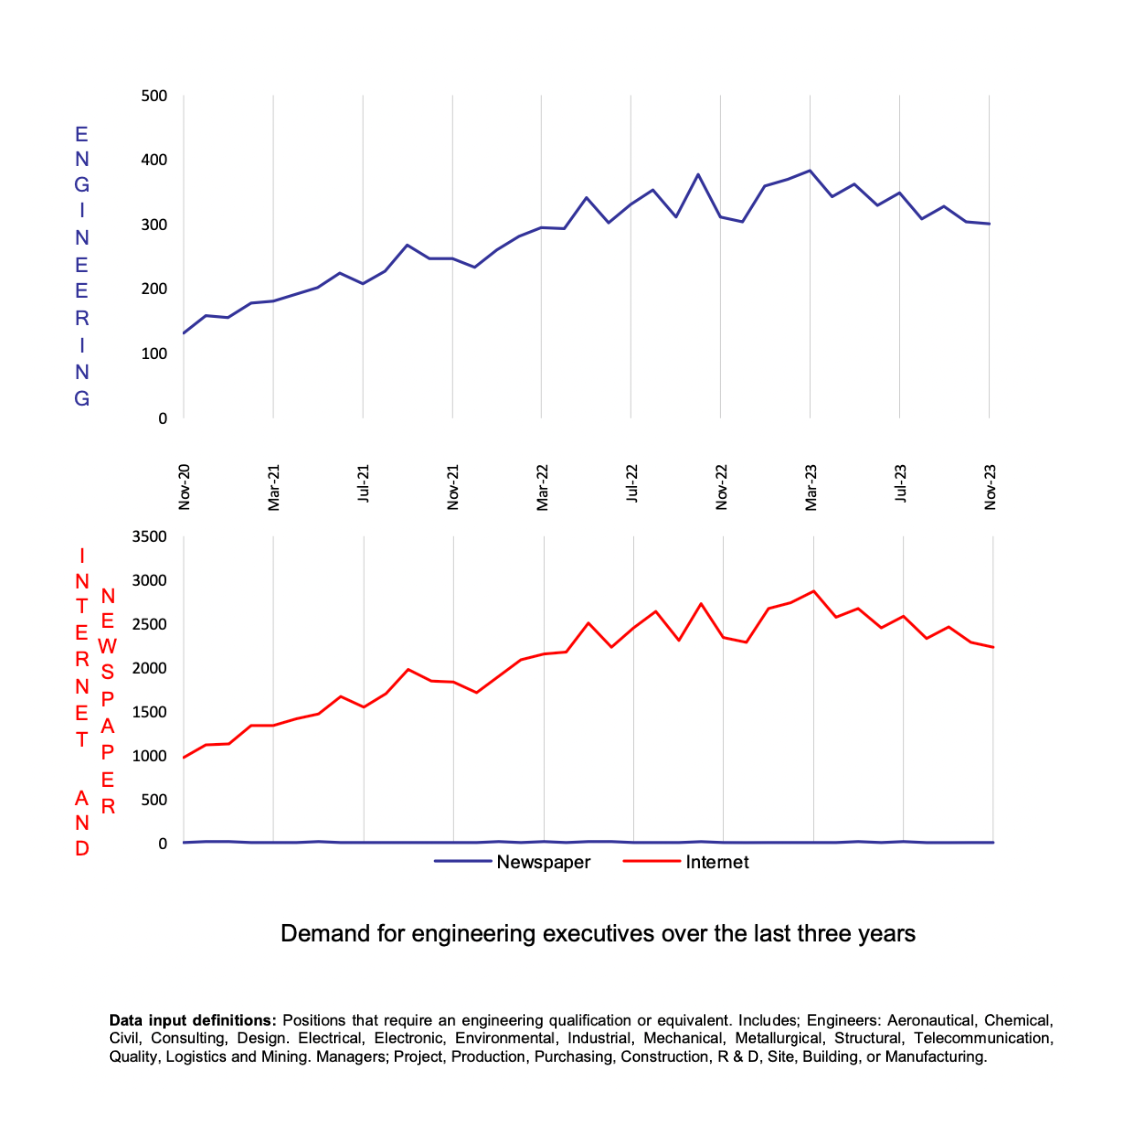
November 2023 E.L Engineering Index
November 2023 E.L Engineering Index: 300
Same period last year (November 2022): 312
Percentage change over last month: -1%
Engineering recorded a 1 per cent decrease compared with the prior month, producing a better than expected result but still a reduction compared with other sectors.
The losses in Engineering meant it has clearly drawn down on its long-term average, having come off its high reached in March 2023.
Again, it is notable that the Engineering index is losing ground in a period when the Reserve Bank continues to raise rates. Such rises in rates can be expected to affect economic strength as we enter 2024.
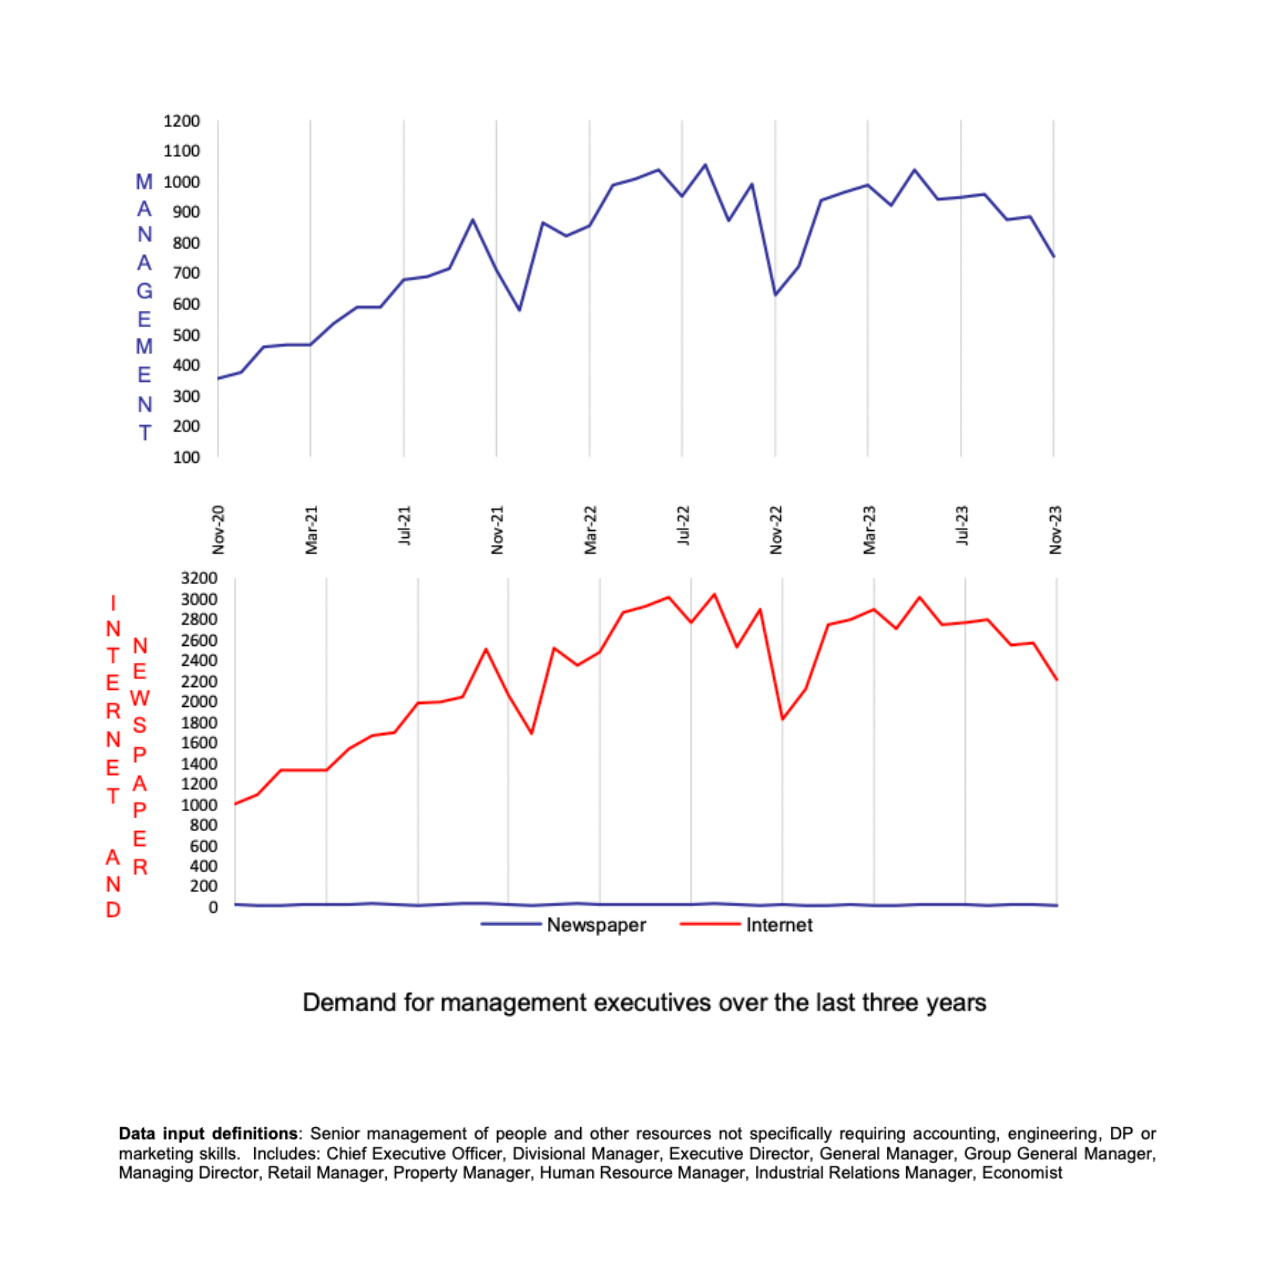
November 2023 E.L Management Index
November 2023 E.L Management Index: 756
Same period last year (November 2022): 628
Percentage change over last month: -14%
The Management sector has produced the second largest fall out of all the sectors in November, falling 14 per cent in November compared with the prior month.
Management has now been one of the more topsy turvy indices given that it has been previously more stable (in an upward level) in 2021.
It is likely that Management will reach the levels of November 2022 in the next few months.
In November there were significant losses in New South Wales, Victoria and Western Australia.
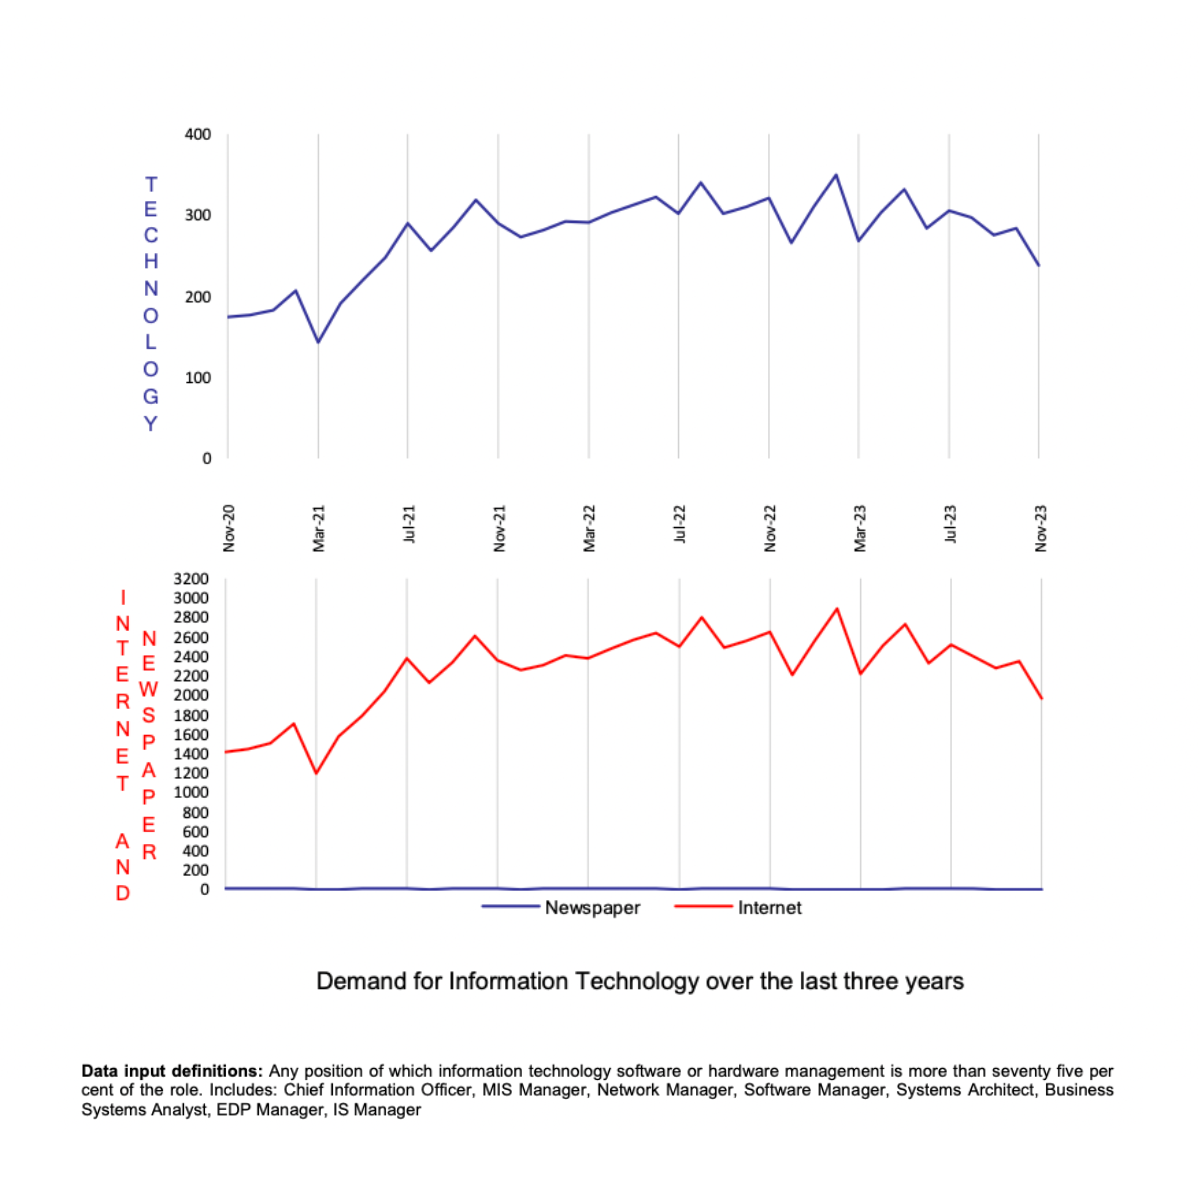
November 2023 E.L Information Technology Index
November 2023 E.L Information Technology Index: 237
Same period last year (November 2022): 321
Percentage change over last month: -16%
Information Technology lost a substantial 16 per cent in November, meaning it has now moved 26 per cent lower than this time last year.
The index is now in the lower part of its recent trading range, showing the force of higher interest rates.
The losses were extensive, with Web advertising lower in both the business and government sectors, and print-based ads also lower in the same sectors.
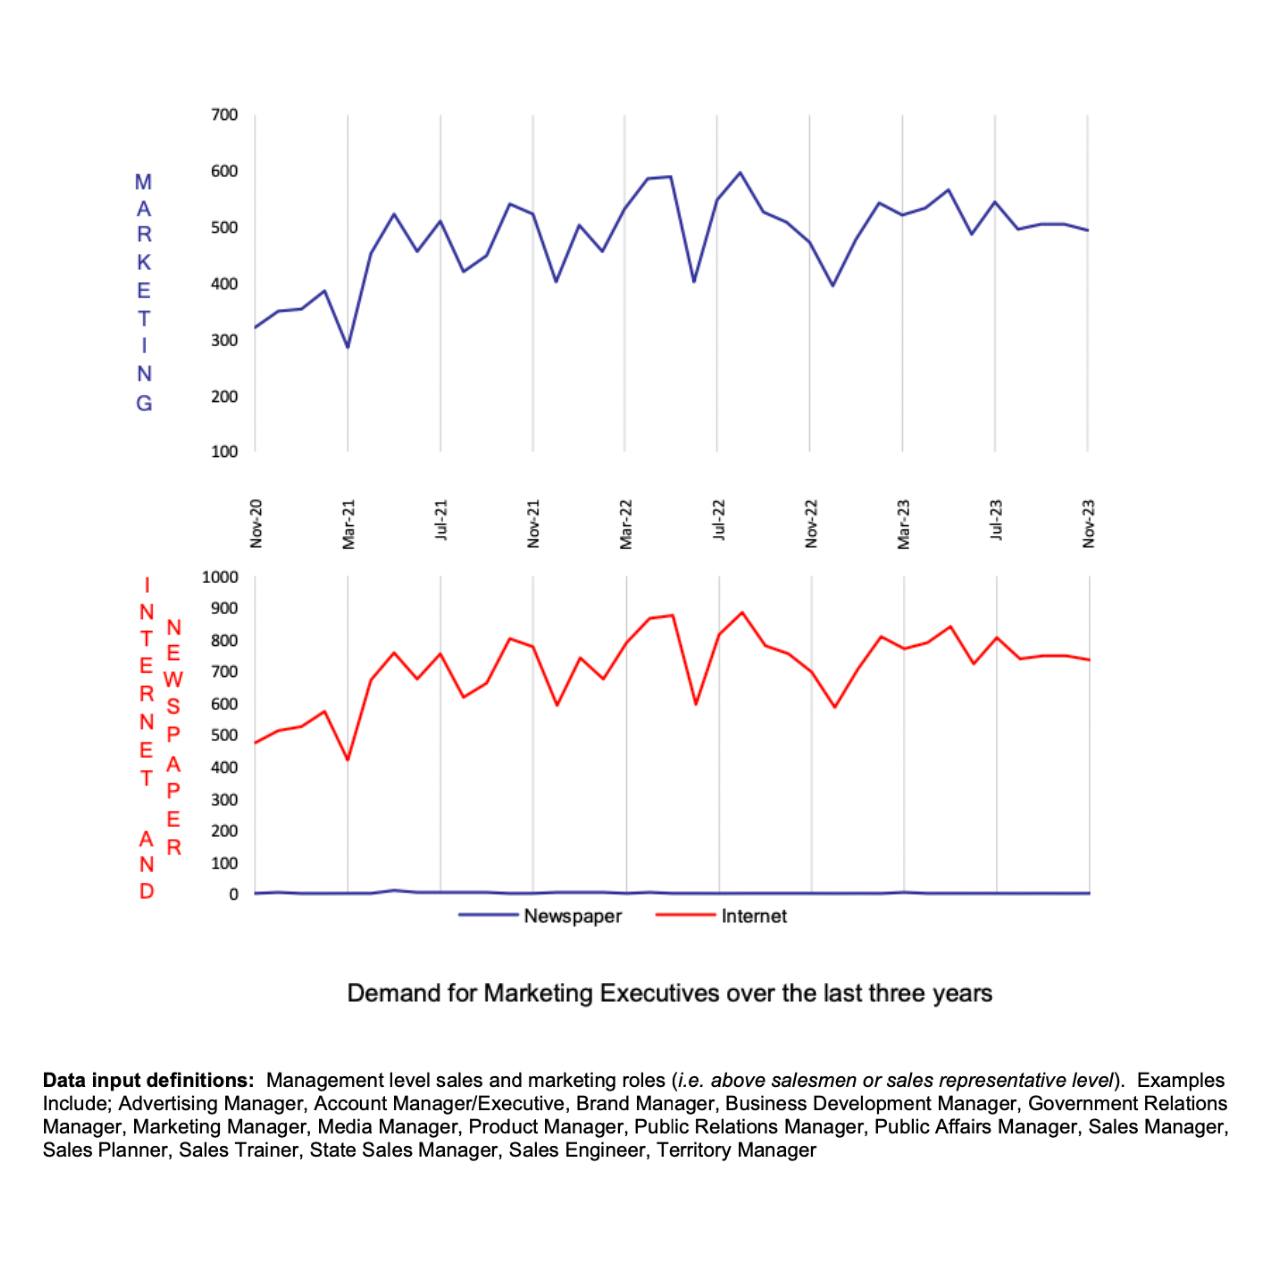
November 2023 E.L Marketing Index
November 2023 E.L Marketing Index: 495
Same period last year (November 2022): 472
Percentage change over last month: –2%
The losses in Marketing over the past year has levelled off in November, but the topsy turvy overall results continues. Compare that Marketing is at 495 versus 472 in the prior year, whereas (as mentioned above) Information and Communications Technology has now moved 26 per cent lower than this time last year.
In November, print advertising was flat in both the business and government sectors. Web-based business sector ads were off.
Amid the states and regions, New South Wales and the ACT were up – one of the few areas in the indices that were higher. However, Victoria and the Northern Territory were lower.
About the E.L Index
The E.L Index is a comprehensive monthly analysis of employment trends at an executive level. An Australian analysis is produced in Sydney and an Asian analysis in Hong Kong and Singapore.
The E.L Index has been shown by two separate University studies to correlate strongly with general economic and business trends. It is featured by most of the major news services and is closely followed by government and central bank analysts.
The E.L Index is a combined national index of all executive demand made up of five separate indices; the E.L Finance Index, the E.L IT Index, the E.L Management Index, the E.L Marketing Index and the E.L Engineering Index.
The National and specific career group Indexes are shown as relative indexes recording the monthly demand activity for executive positions in the current month against the demand in a historical base period which is normalised to 100. The historical base period used was the average of the last quarter of 1992 which research showed to be the bottom of that downturn.
By averaging to a historical base period the comparison of, say, June 1994 to June 2000 is meaningful, giving a clean, easily understood appreciation of changing investment and economic trends without seasonal obscurity.
The E.L Index utilises data from both print and internet sources and is the only employment index to do so.
The print data is collected from the major employment papers in each state. National papers are not used to avoid “doubling up”. Internet data is not collected off the websites which can be subject to some error but instead collected through raw data provided by the ISPs themselves. Print data has over 15 years of historical data and the internet has more than 6 years.
Why Executive Demand is a Primary Lead Indicator?
It is often claimed that unemployment figures and broad-based job vacancy surveys do not give a fair impression of what is occurring in executive ranks. The E.L Index addresses this and has some interesting correlative and predictive qualities. Such as:
– Employment of management usually precedes the employment of skilled and unskilled workers.
– Employment of engineering executives precedes major capital investment.
– The division between various management sectors gives an indication of which sectors of the economy are experiencing growth or decline.
– Compares month-by-month changes in the public and private sectors as well as monitoring government expenditure patterns.
– Makes regional comparisons after allowing for population differences.
– It shows a ‘rate of change’ and can therefore be realistically compared to general economic and employment growth, unlike some surveys that report absolute numbers.
– Core data is collected on an actual expenditure of business and government, not on a respondent’s opinion or confidence level.
