

Executive job demand falls as the government’s big spend subsides.
Productivity is struggling and the economy is hurting.
Investment hype in AI is overtaking the emergence of its proven benefits.
Demand for Executive Positions in Australia in November 2024
The executive job market’s significant burst has halted after two consecutive months of strong gains, according to the E.L. Executive Demand Index.
The EL Index fell 19 per cent in October, while still retaining some of the previous month’s increases and all of the increases in August.
Mr Grant Montgomery, Managing Director of E.L Consult, a leading executive search firm that has researched and published the E.L. Executive Demand Index for over 30 years, said: “The huge increase in executive positions over the last two months has stabilised.
“In fact, it has largely corrected itself by dropping 19 per cent.
“It is now obvious that the last two months were an aberration spurred by silent but excessive government spending which is now tracking back to a less volatile curve.
“While bad news if you are an unemployed executive, it is actually pretty good news for the economy in general. Excessive non productivity-related rises in employment play straight into inflation.
“As difficult as it is for a Labor government, employment levels must fall for inflation to be tamed.
“This is economic theory in one of its most traditional forms and credited to John Maynard Keynes – one of the few economists to actually make money from his theories.
Australia’s Productivity Growth Concerns
“We also need to improve our sagging productivity growth.”
According to the Bureau of Statistics, long-term labour productivity growth (based on 20-year average annual growth rates) was steady between 2003 and 2016 but has slowed considerably since then.
“It is now just 0.9%, falling from 1.2% in 2021-22 and 1.8% in 2003.
“The Productivity Commission has said that while a record number of Australians have jobs employers have stopped investment in new tools and equipment needed to make the most of employees’ skills and the government has tried to re-unionise employment further forcing down productivity.
Further capital investment is needed to turn our strong employment growth into strong productivity
growth, and that means that government policy needs to be more accommodative to investment.
“There is a chance that the change in the political landscape in the US will drive Australian government policy to be a little more focused on the economy and less on woke agendas. We will have to wait and see. Montgomery said.
“The economy is weaker than most people are aware and will slow down even as we approach December and January and our analysis shows it will get worse before improving.
“It is s pretty safe bet to say ‘Sorry no rate drops this year’ and it is unlikely there will be any interest rate relief until mid-2025 – just the sad cost of big spending deficit budgets.
Calls for Increased Capital Investment
“One of the most surprising falls was a massive drop in information technology executive positions This month it dropped a massive 47 percent to return to its falling longer-term trend.
“No doubt a lot of public and private lemmings have rushed at the AI hype believing they are on the verge of a boom like no other.
“Sure, AI will start to ramp up and produce some good outcomes, but it needs some careful and long term germination to play out.
“Fortunately, it appears that this hysteria has moderated, at least, for this month.”
All states and territories fell, led by Queensland among the large states and Tasmania among the smaller ones.
Sector-wide, Information Technology led the way lower with its 47 per cent slide, followed by Marketing and Management. Government sector retractions played a large role in the overall decreases.
Call Grant Montgomery on +612 9221 6688 or 0414926688 for further details
October 2024 Statistics
October 2024 National Index
October 2024 National Index: 548
Same period last year (October 2023): 604
Percentage change over last month: -19%
National Summary
The executive job market’s significant growth has halted after two consecutive months of strong gains.
The EL Index fell 19 per cent, retaining some of the previous month’s increases and all of the increases in August.
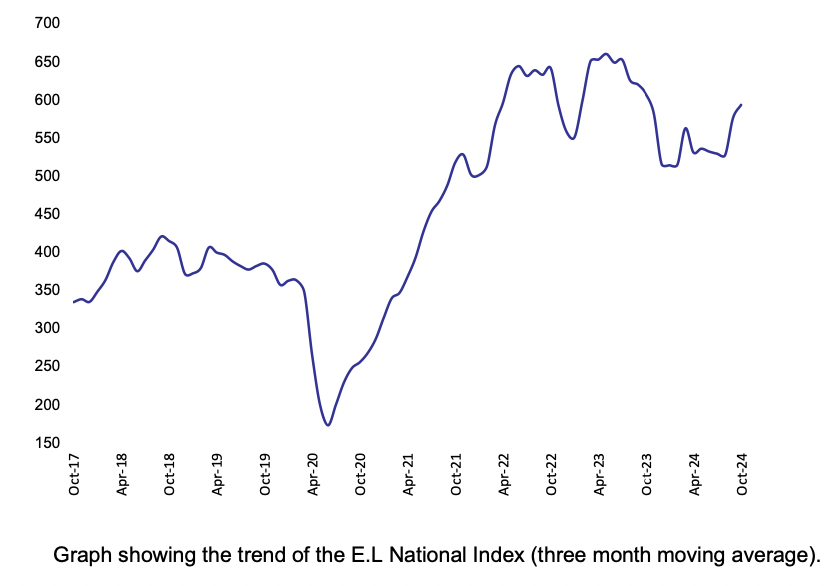
National Demand for Executives Over Last Seven Years
The recent gains have fed through to the long-term trends, but the trend is still lower than in prior years.
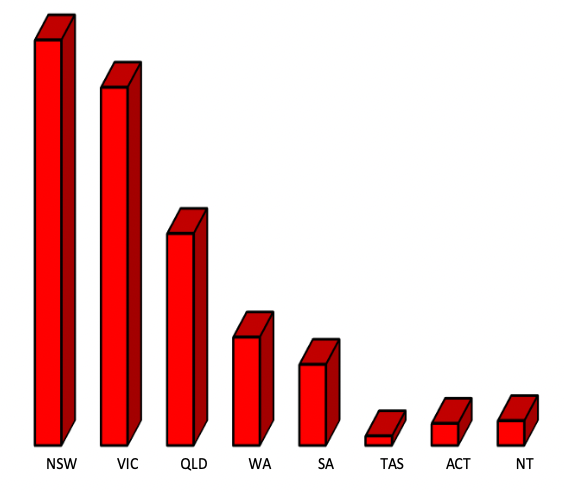
State by State Comparison
All states and territories fell, led by Queensland among the large states and Tasmania among the smaller regions.
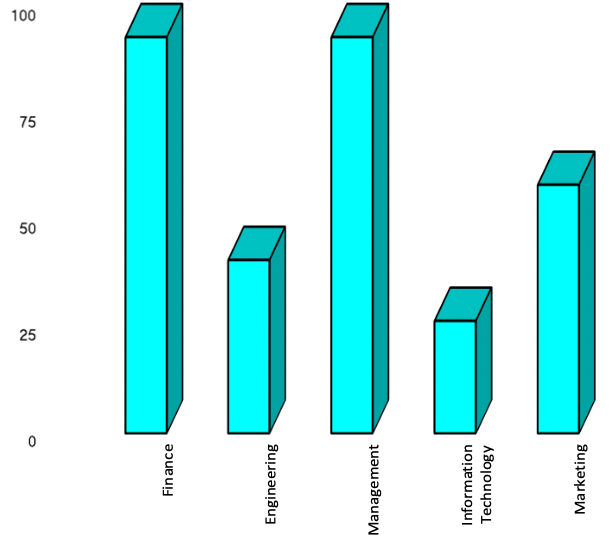
Employment Trends for Executive Groups
Among the sectors, Information Technology led the way lower with its 47 per cent slide, followed by Marketing and Management. Government sector retractions played a large role in the overall decreases.
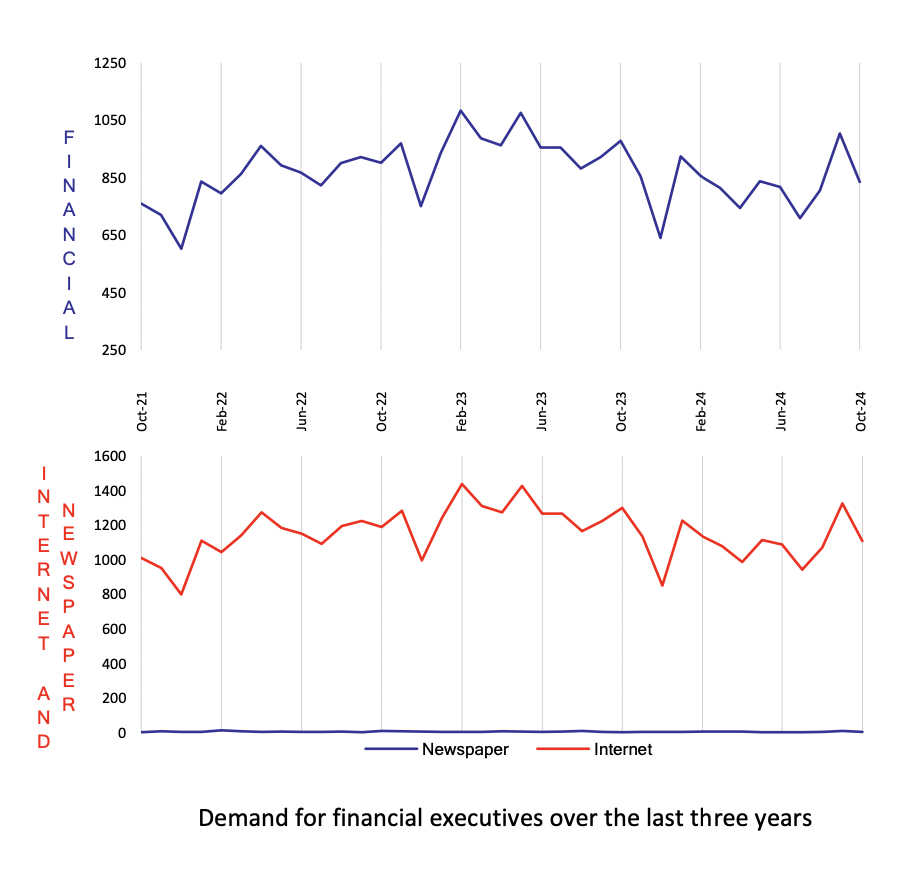
October 2024 E.L Finance Index
October 2024 E.L Finance Index: 835
Same period last year (October 2023): 978
Percentage change over last month: -17%
Financial positions have dropped most of the gains in the prior month, falling 17 per cent in October.
However, the Finance Index remains in the middle of its recent trading range.
Every state and territory moved lower over the month, with Queensland the biggest loser out of the large states and the ACT the biggest loser out of all the smaller regions.
Positions were lower in all advertising types, particularly the web-based government sector.

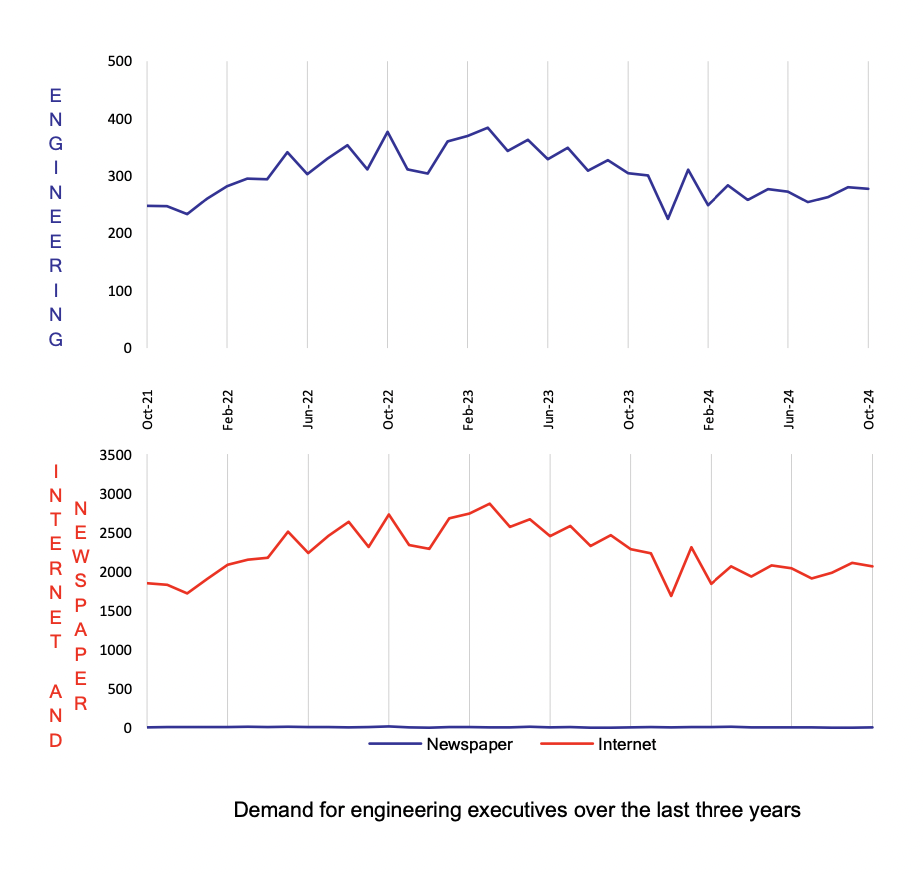
October 2024 E.L Engineering Index
October 2024 E.L Engineering Index: 278
Same period last year (October 2023): 304
Percentage change over last month: -1%
Engineering recorded a 1 per cent decrease compared with the prior month, making it the smallest loser out of the sectors for October.
The Engineering Index remains near the top of its recent trading range, meaning that in general terms 2024’s performance so far has been the best out of all the sectors.
Unlike the other sectors during the month, there were some states that gained compared to the prior month. Queensland and South Australia were higher, and the losses in the largest states of New South Wales and Victoria were small.
One hopes that Engineering can continue to have an even upward trend as we approach the end of the year, given its importance in pushing long-term productivity and growth.

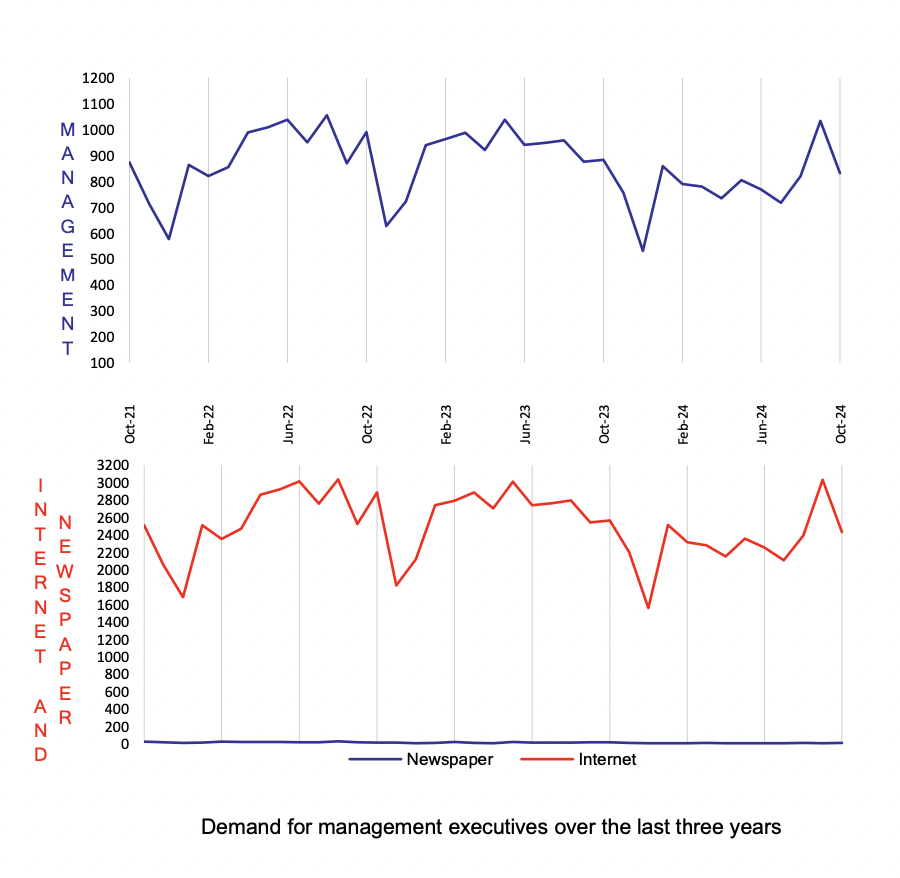
October 2024 E.L Management Index
October 2024 E.L Management Index: 831
Same period last year (October 2023): 884
Percentage change over last month: -20%
The Management sector was another that moved backwards but kept some of its gains from September, dropping 20 per cent in October.
Although the Management sector has been volatile, point to point it has seen gains in 2024.
Most states and territories fell in the month, with only the Northern Territory moving forward. Print-based advertising was actually higher over the month, but web-based advertising was lower. Government-funded positions were the weakest in the web-based territory.

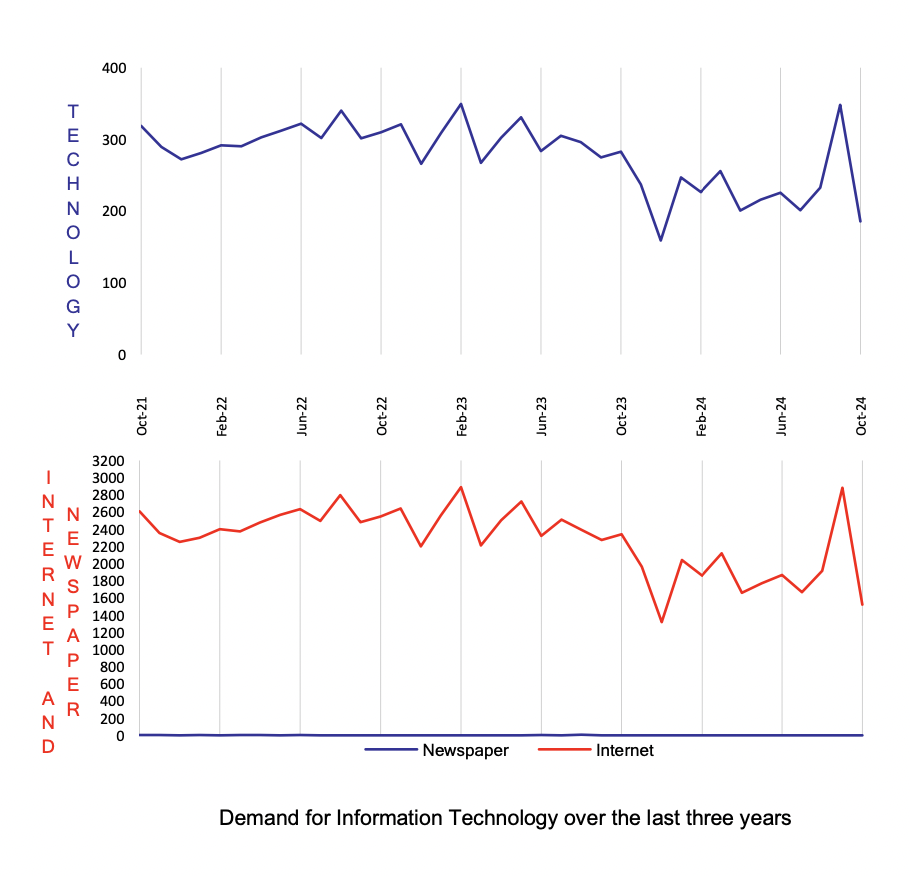
October 2024 E.L Information Technology Index
October 2024 E.L Information Technology Index: 186
Same period last year (October 2023): 283
Percentage change over last month: -47%
Information Technology continued its see-saw behaviour, falling 47 per cent over the prior month.
Unlike many of the other sectors in October, there were significant losses in both the web- based business sector and web-based government sector.
Losses were extensive in all states and territories, with Queensland the biggest loser out of the big states and the ACT the biggest loser out of the smaller states.

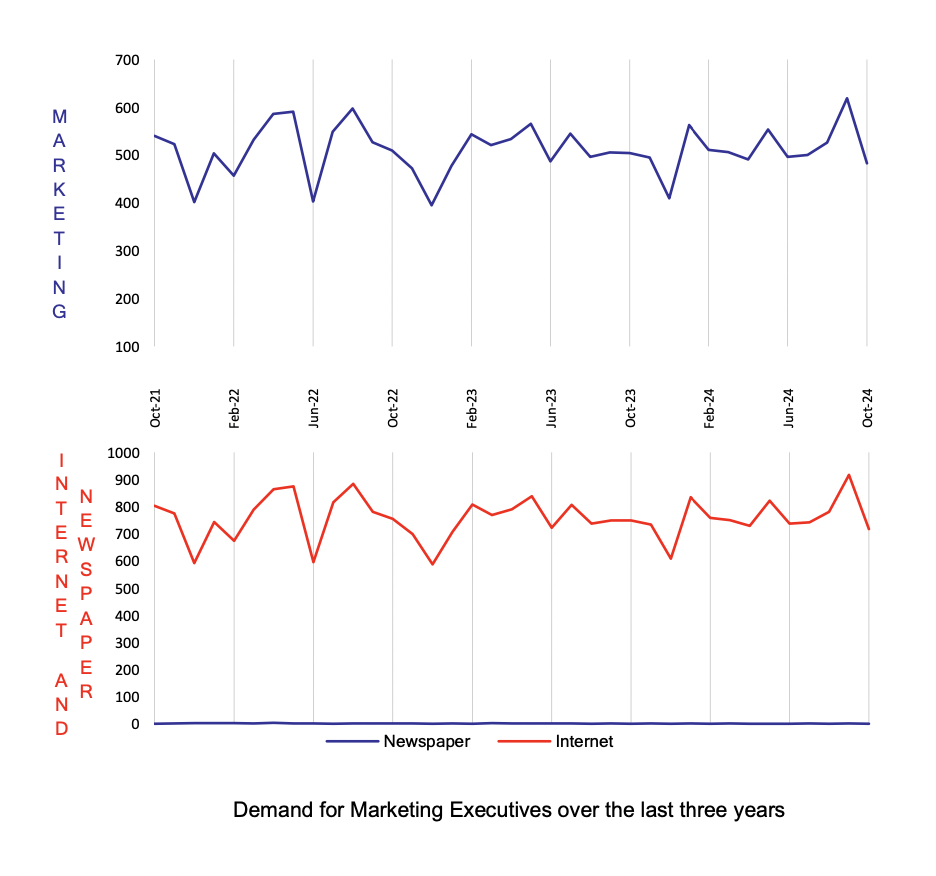
October 2024 E.L Marketing Index
October 2024 E.L Marketing Index: 483
Same period last year (October 2023): 504
Percentage change over last month: -22%
After a straight quarter of positive results, the Marketing index lost 22 per cent in October compared with the prior month.
The Marketing Index is now back in the middle of its recent trading range, despite the loss.
Amid the states and regions, all the large states fell, although Western Australia registered a second consecutive month of gains.
Government sector advertising was lower in both the print and online arenas, and in fact contributed most of the negative trend during the month.

About the E.L Index
The E.L Index is a comprehensive monthly analysis of employment trends at executive level. An Australian analysis is produced in Sydney and an Asian analysis in Hong Kong and Singapore.
The E.L Index has shown by two separate University studies to correlate strongly with general economic and business trends. It is featured by most of the major news services and is closely followed by government and central bank analysts.
The E.L Index is actually a combined national index of all executive demand made up of five separate indices; E.L Finance Index, E.L IT Index, E.L Management Index, E.L Marketing Index and the E.L Engineering Index.
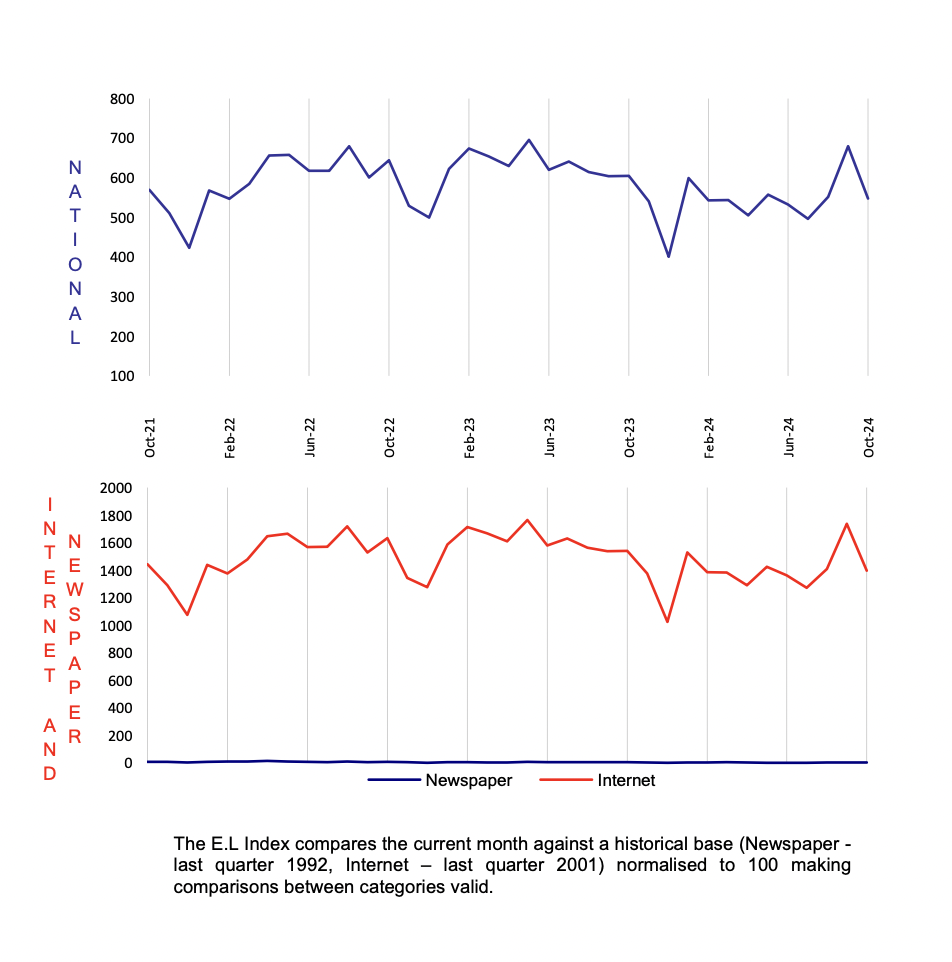
The National and specific career group Indexes are shown as relative indexes recording the monthly demand activity for executive positions in the current month against the demand in a historical base period which is normalised to 100. The historical base period used was the average of the last quarter of 1992 which research showed to be the bottom of that downturn.
By averaging to a historical base period the comparison of, say, June 1994 to June 2000 is meaningful, giving a clean, easily understood appreciation of changing investment and economic trends without seasonal obscurity.
The E.L Index utilises data from both print and internet sources and is the only employment index to do so.
The print data is collected from the major employment paper in each state. National papers are not used to avoid “doubling up”. Internet data is not collected off the web sites which can be subject to some error but instead collected through raw data provided by the ISP themselves. Print data has over 15 years of historical data and the internet more than 6 years.
Why Executive Demand is a Primary Lead Indicator?
It is often claimed that unemployment figures and broad-based job vacancy surveys do not give a fair impression of what is occurring in executive ranks. The E.L Index addresses this and has some interesting correlative and predictive qualities. Such as:
-
Employment of management usually precedes the employment of skilled and unskilled workers.
-
Employment of engineering executives precedes major capital investment.
-
The division between various management sectors gives an indication of which sectors of the economy are experiencing growth or decline.
-
Compares month by month changes in the public and private sector as well as monitoring government expenditure patterns.
-
Makes regional comparisons after allowing for population differences.
-
It shows a ‘rate of change’ and can therefore be realistically compared to general economic and employment growth unlike some surveys that report absolute numbers.
-
Core data is collected on an actual expenditure of business and government, not on a respondent’s opinion or confidence level.
