Executive demand shows signs of recovery as the financial year closes
Government spending in Tasmania and Victoria drives notable shifts
Australia’s executive employment market has recorded a partial rebound following April’s sharp downturn, with the E.L. Executive Demand Index rising 12 per cent month-on-month.
While the increase does not fully reverse the previous decline, it provides meaningful relief as the end of the financial year approaches.
Grant Montgomery, Managing Director of E.L Consult — Australia’s leading executive search firm and publisher of the E.L. Executive Demand Index for more than 30 years — said the result was unexpected.
“In a surprise outcome, senior executive employment actually improved this month by almost the same magnitude as April’s fall,” Mr Montgomery said.
“We see this as a slight anomaly. The data was captured immediately after the Federal Budget, but businesses do not make hiring decisions quickly. We expect to see significant ramifications from the budget’s anti-aspirational measures, particularly for small businesses and start-ups in coming months.”
Victoria delivered the strongest performance among the major states, rising 17 per cent.
“Victoria is heading into an election cycle and spending heavily to improve its polling. Like the Federal Government, it is an overspending, over-taxing administration that may or may not be held to account down the track,” Mr Montgomery said.
New South Wales recorded the weakest growth at 4 per cent. “Calling it the ‘worst’ result is interesting, because slowing employment is exactly what is needed to curb inflation — a key indicator for the Reserve Bank when adjusting interest rates.
Given NSW’s heavy reliance on property investment, the budget’s CGT changes may have spooked the market. As the largest state, businesses there are likely to delay long-term hiring decisions until they understand how the tax changes will affect the broader economy. We suspect other states may follow NSW’s trajectory once the full impact on business and consumer confidence becomes clear.”
Tasmania fell 13 per cent, though the small size of its market meant the decline had little effect on the national result. What stood out, however, was the composition of roles advertised.
“Nearly a third of all executive positions in Tasmania were government roles — far higher than any other state. In fact, the proportion of government executive jobs was more than three times that of the ACT, the next highest jurisdiction. This follows a significant rise in management roles in April. Perhaps the stadium build is already drawing in funds,” Mr Montgomery said.
He also noted a structural shift in how senior roles are advertised. “We are now seeing a complete collapse in print media advertising for executive jobs. The death of print won’t surprise anyone, but employers once liked to place ‘tombstone’ ads for reputational reasons. No more — the rivers of gold have become a puddle. The days of poring over a thick Friday AFR or a heavy SMH full of executive ads are long gone.”
State-by-state performance
• Victoria: strongest growth among major states
• New South Wales: smallest increase, reflecting caution around budget impacts
• South Australia: strongest of the mid-tier states
• Western Australia and Queensland: moderate gains
• ACT: strongest performer among small jurisdictions
• Tasmania: negative result despite high government hiring activity
Sector performance
Engineering led the recovery, driven largely by government-funded roles in Victoria. Other sectors showing improvement included Marketing, Management, Information Technology, and Financial Services.
Call E.L Blue on +612 9221 6688 for further details.
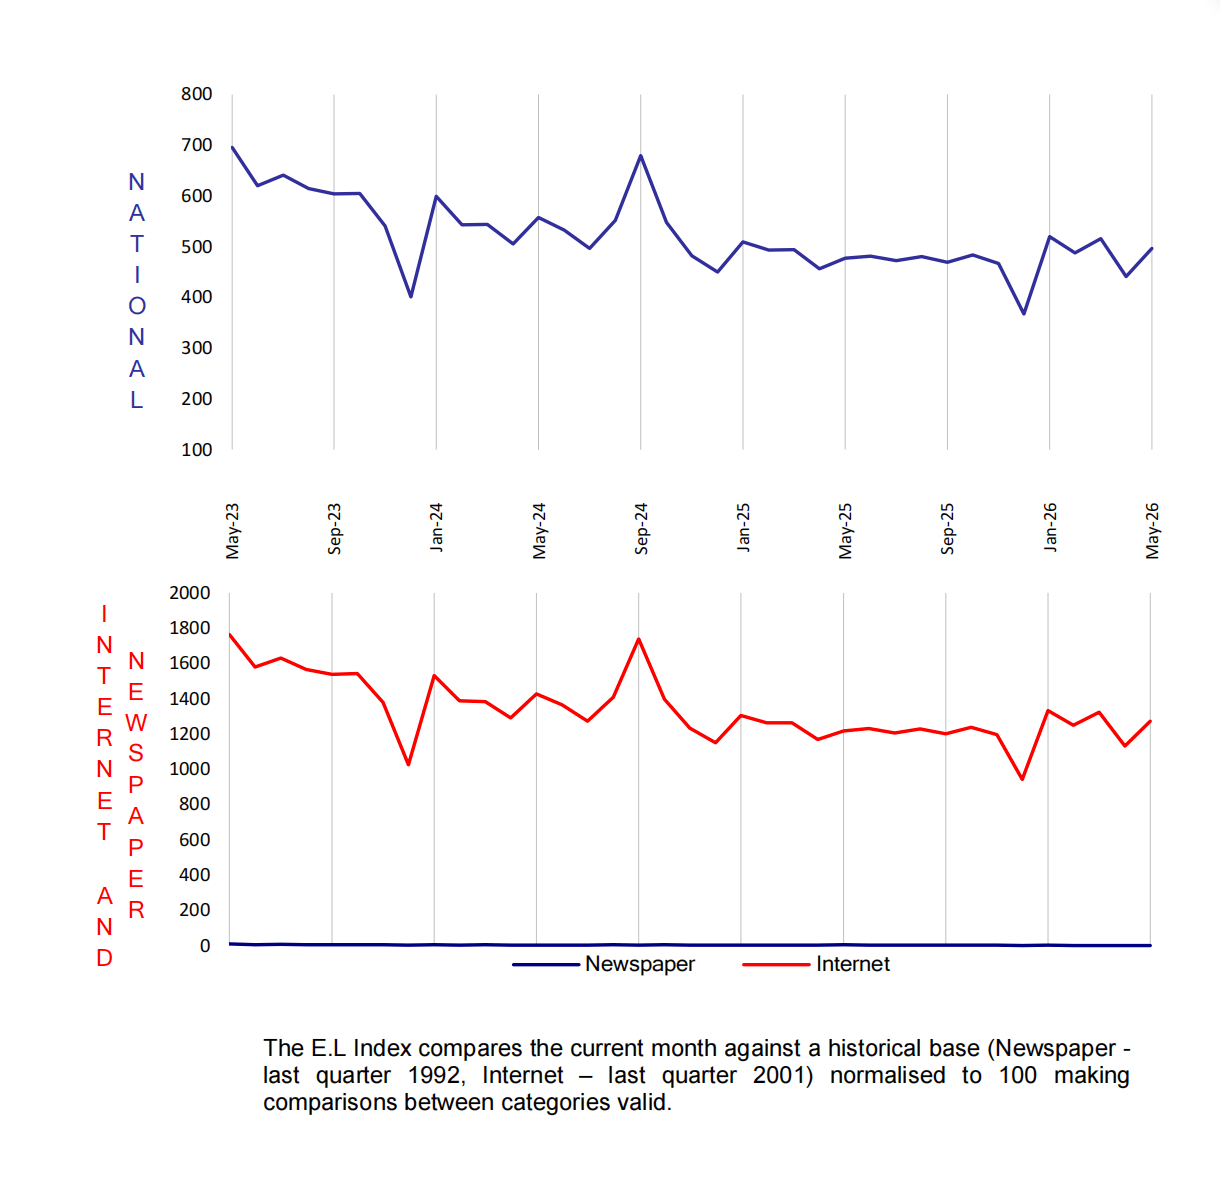
May 2026 E.L Index National
| May 2026 National Index: | 496 |
| Same period last year (May 2025): | 477 |
| Percentage change over last month: | 12% |
National Summary
After the April executive job crunch, the E.L. Executive Demand Index has seen a partial recovery with a 12 per cent increase over the prior month. The E.L Index’s increase did not totally wipe off the losses immediately prior but did give some reprieve as we get closer to the end of the financial year.
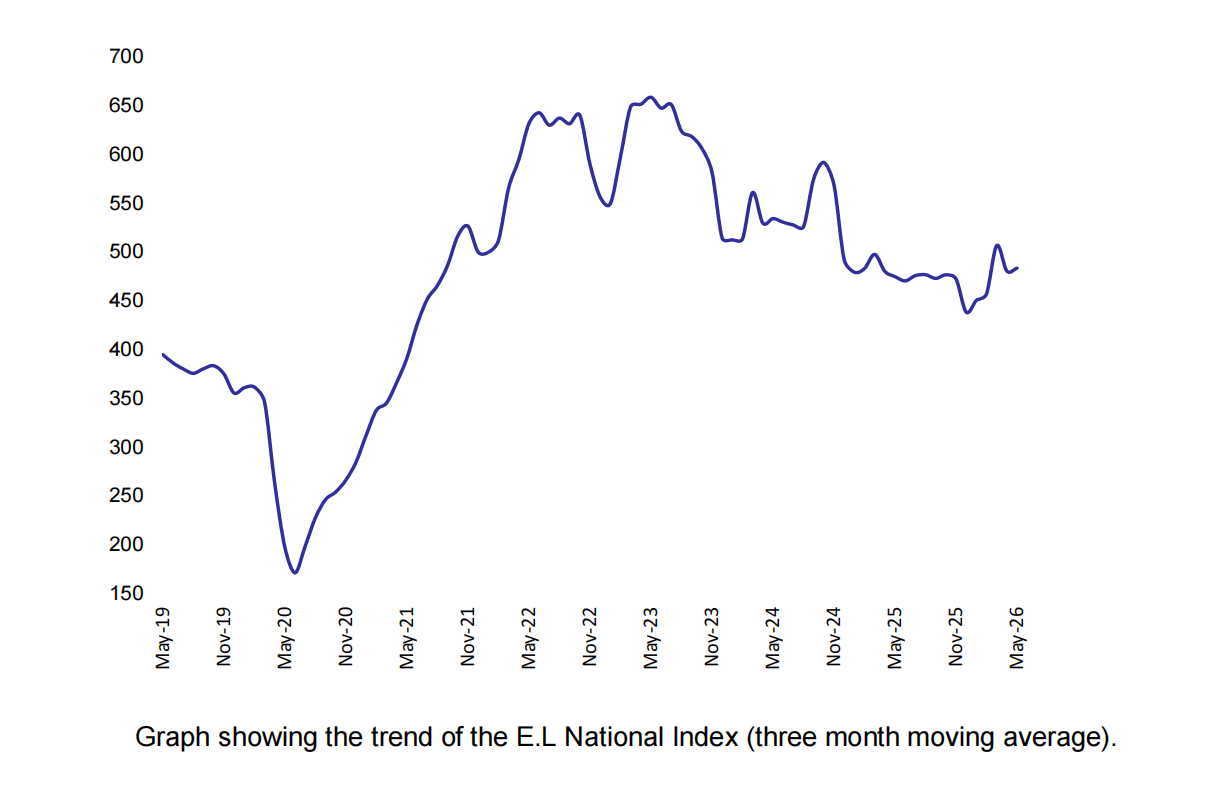
National Demand for Executives over last Seven Years
The executive demand long-term trend has taken a hook turn with the big fall in April and the recovery in May. It would be fair to say that the long-term trend is at an inflection point.
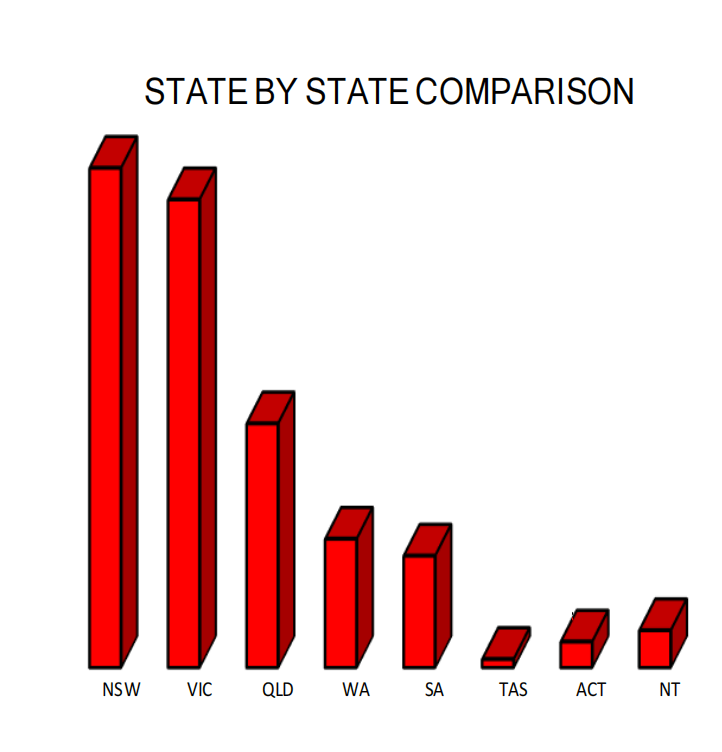
State
Of the two largest states, New South Wales produced the smallest gain and Victoria the largest. South Australia was strongest of the mid-states followed by Western Australia and Queensland, In the smaller the the ACT pulled away while Tasmania was negative despite a high proportion of government jobs on offer.
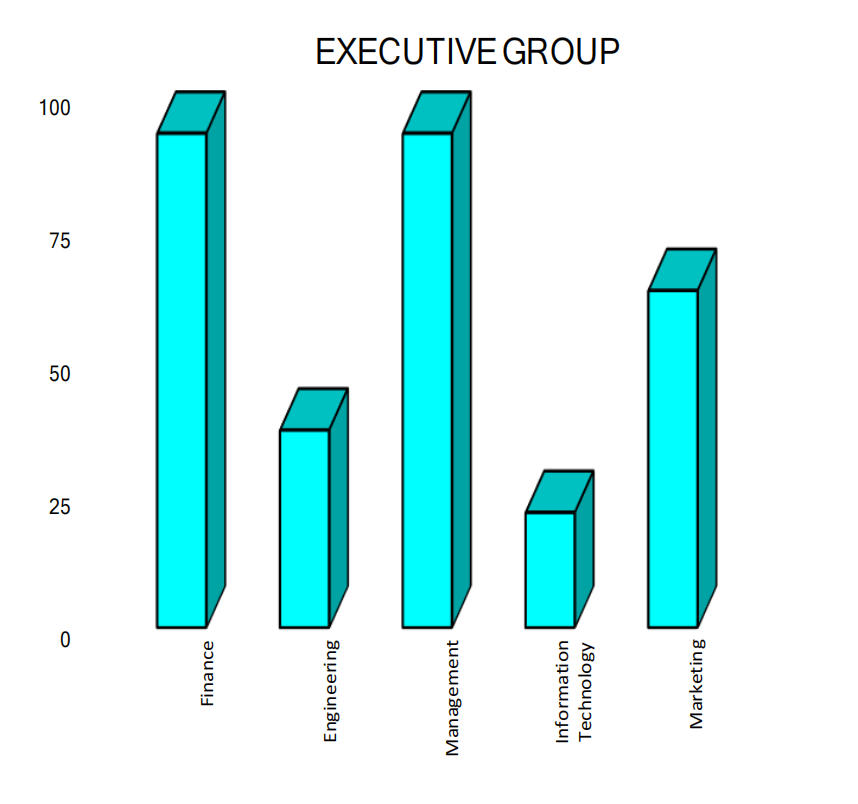
Executive
Among the industry groups, Engineering bounced back thanks largely to a gain in government positions, particularly in Victoria. The Engineering sector was followed in its gains by Marketing, Management, Information Technology and the Financial sector.
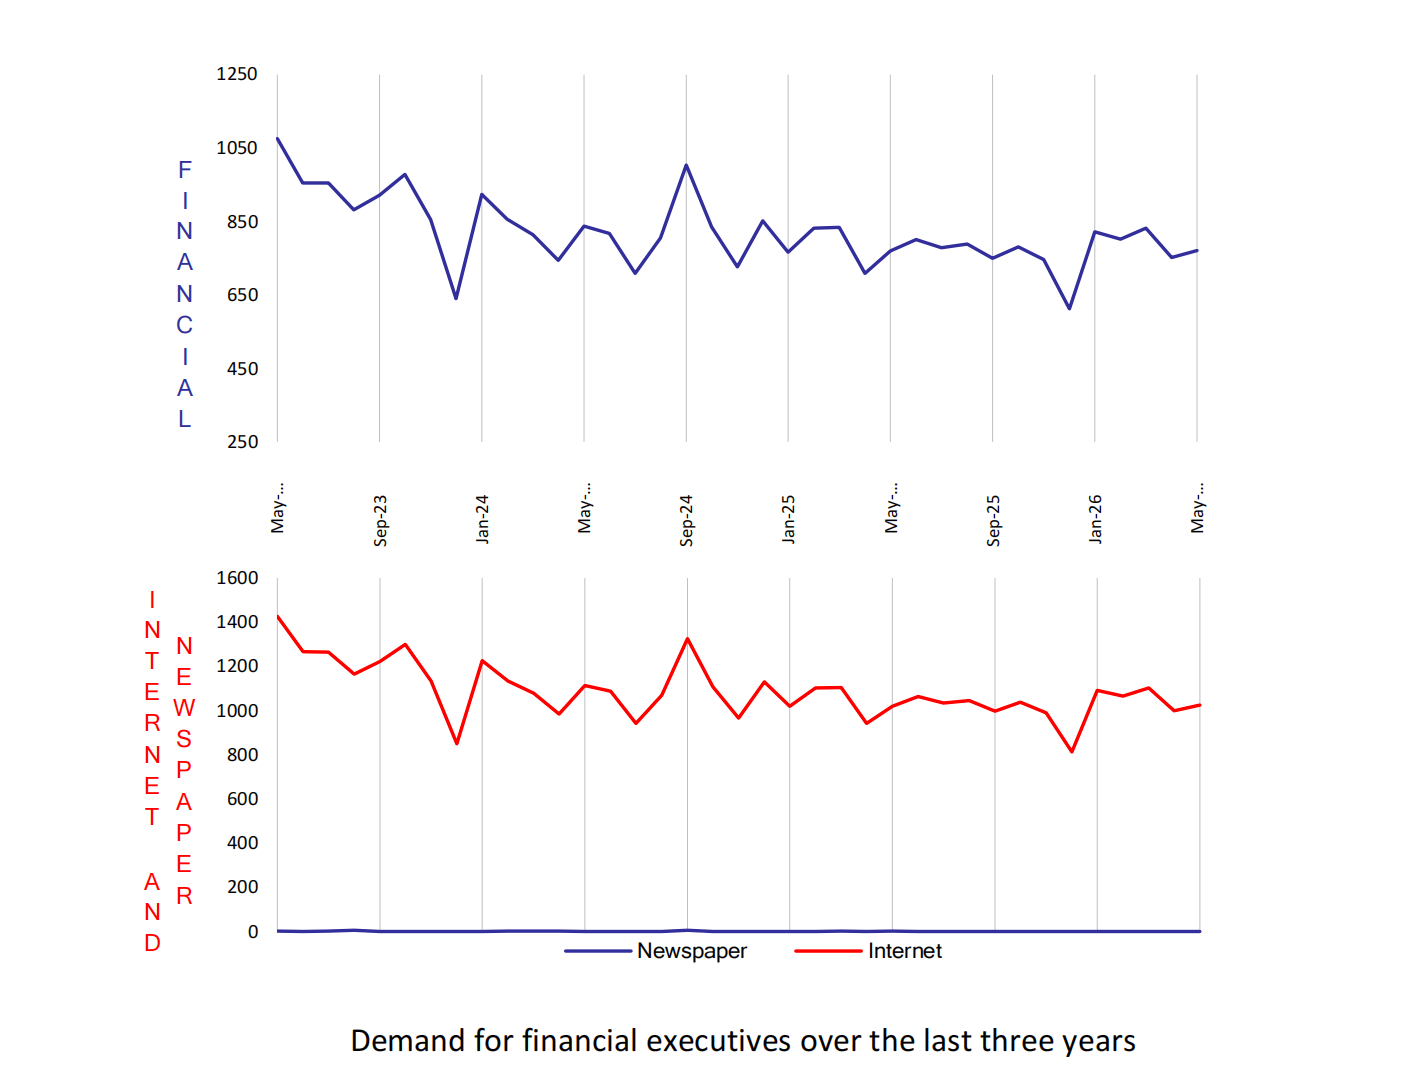
May 2026 E.L Finance Index
| May 2026 E.L Finance Index: | 771 |
| Same period last year (May 2025): | 770 |
| Percentage change over last month: |
2% |
Like much of the overall index this month, the Financial index’s trend has slightly recovered from the beating it took in the prior month, gaining 2 per cent.
The Financial sector saw good support from Victoria, South Australia and, interestingly, Tasmania. Either Tasmania is seeing a major economic boost or just a major spending spree.
The majority of the positions came from the business sector. There were no positions advertised in print media in this sector during the month, underlining how the print media has become irrelevant in the realm of executive recruitment.

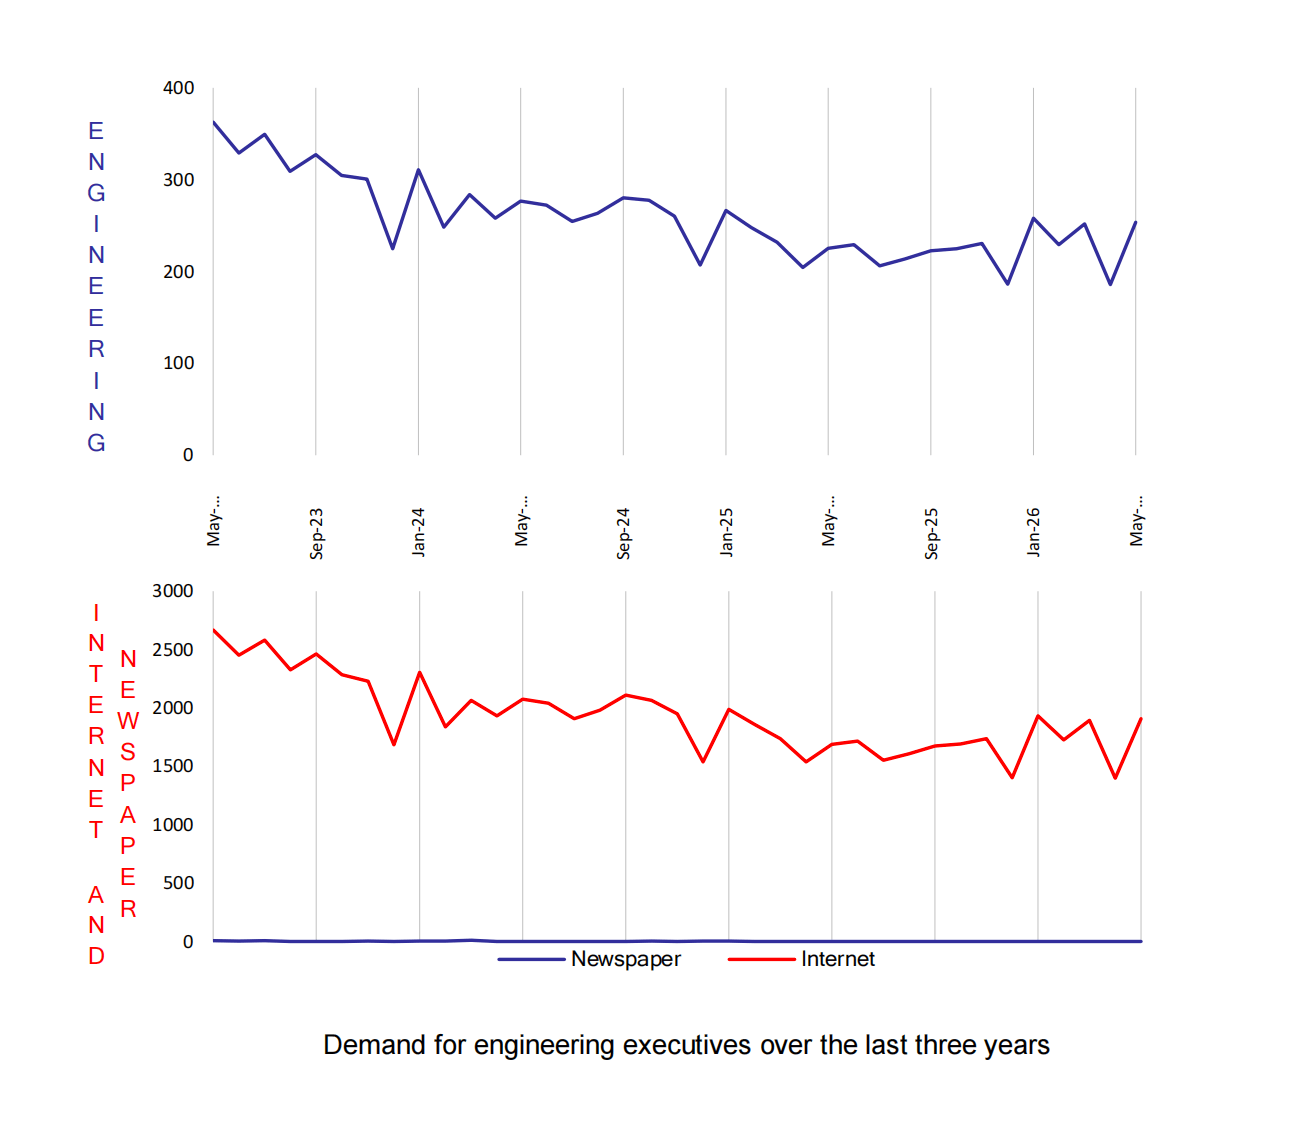
May 2026 E.L Engineering Index
| May 2026 E.L Engineering Index: | 254 |
| Same period last year (May 2025): | 225 |
| Percentage change over last month: | 37% |
Engineering has recovered from its worrying record low, at least for the moment. The EL Index rose 37 per cent compared to the prior month.
It should be noted that Engineering was showing some signs of recovery before the significant April fall, or at least stability, and, if it can retain it, it is a better sign for the Australian economy and capital investment.
However, the big increase came from the government sector which tends to be lumpy; it occurs at the start of projects and then drops away until the later checking stages and confirmation stages.

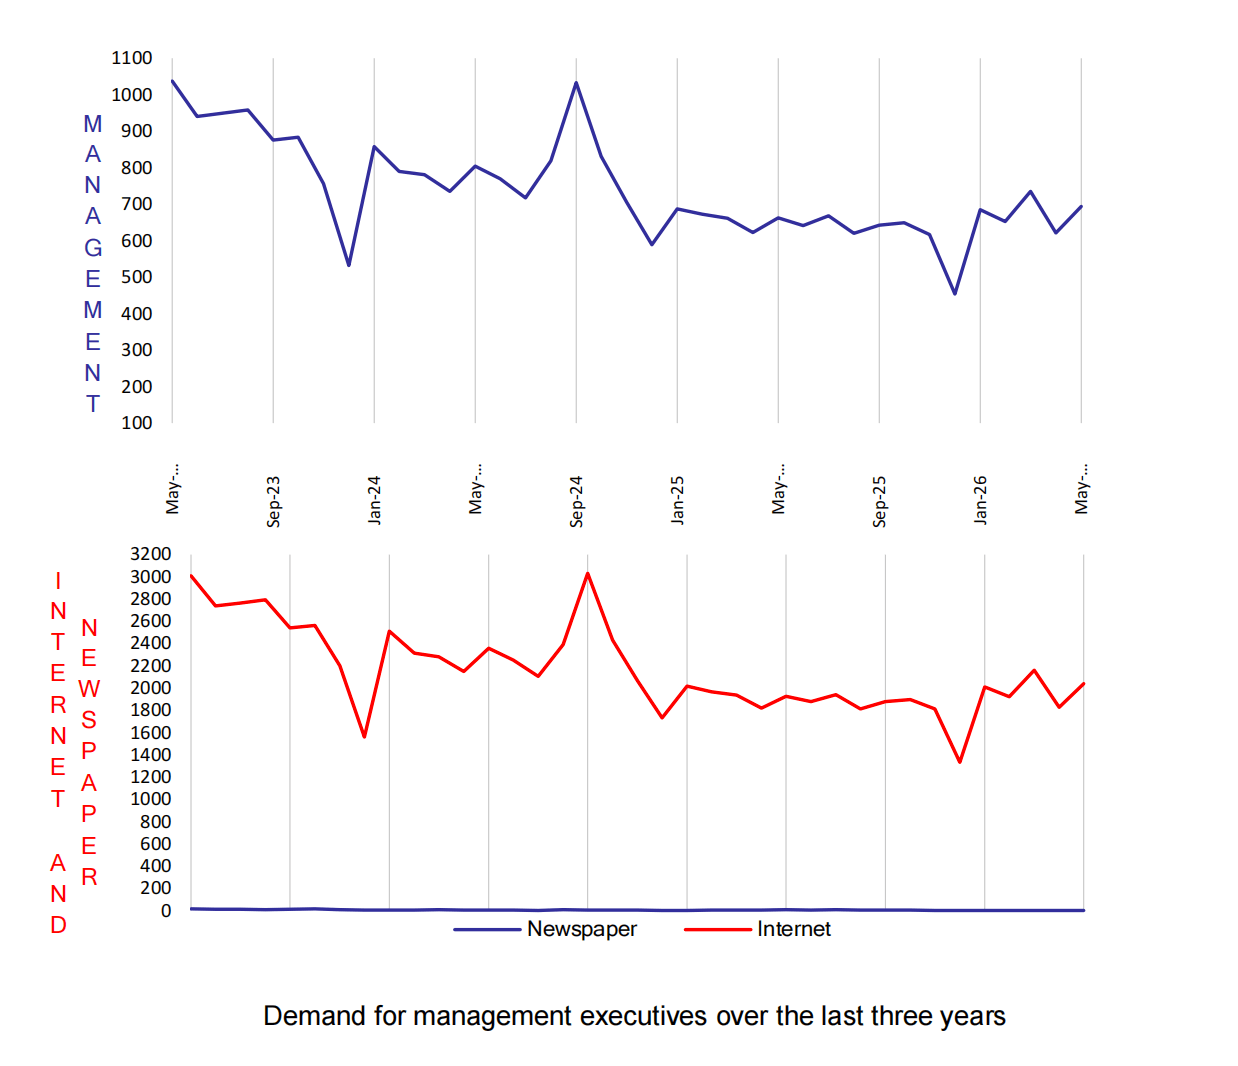
May 2026 E.L Management Index
| May 2026 E.L Management Index:: | 694 |
| Same period last year (May 2025): | 662 |
| Percentage change over last month: | 12% |
New South Wales and Queensland’s negative results were enough to put the overall index into negative territory. After experiencing a less hurtful 2008 than most other sectors, the Management Index is now lagging. In September it lost 1 per cent compared with the prior month.
As a proxy for the government sector and its hiring intentions, bureaucrats in Victoria and South Australia should be pleased as there were significant increases in demand there this month (although demand in those states was lower in the previous month).
However, in contrast to other sectors However, the big increase came from the government sector which tends to be lumpy; it occurs at the start of projects and then drops away until the later checking stages and confirmation stages.

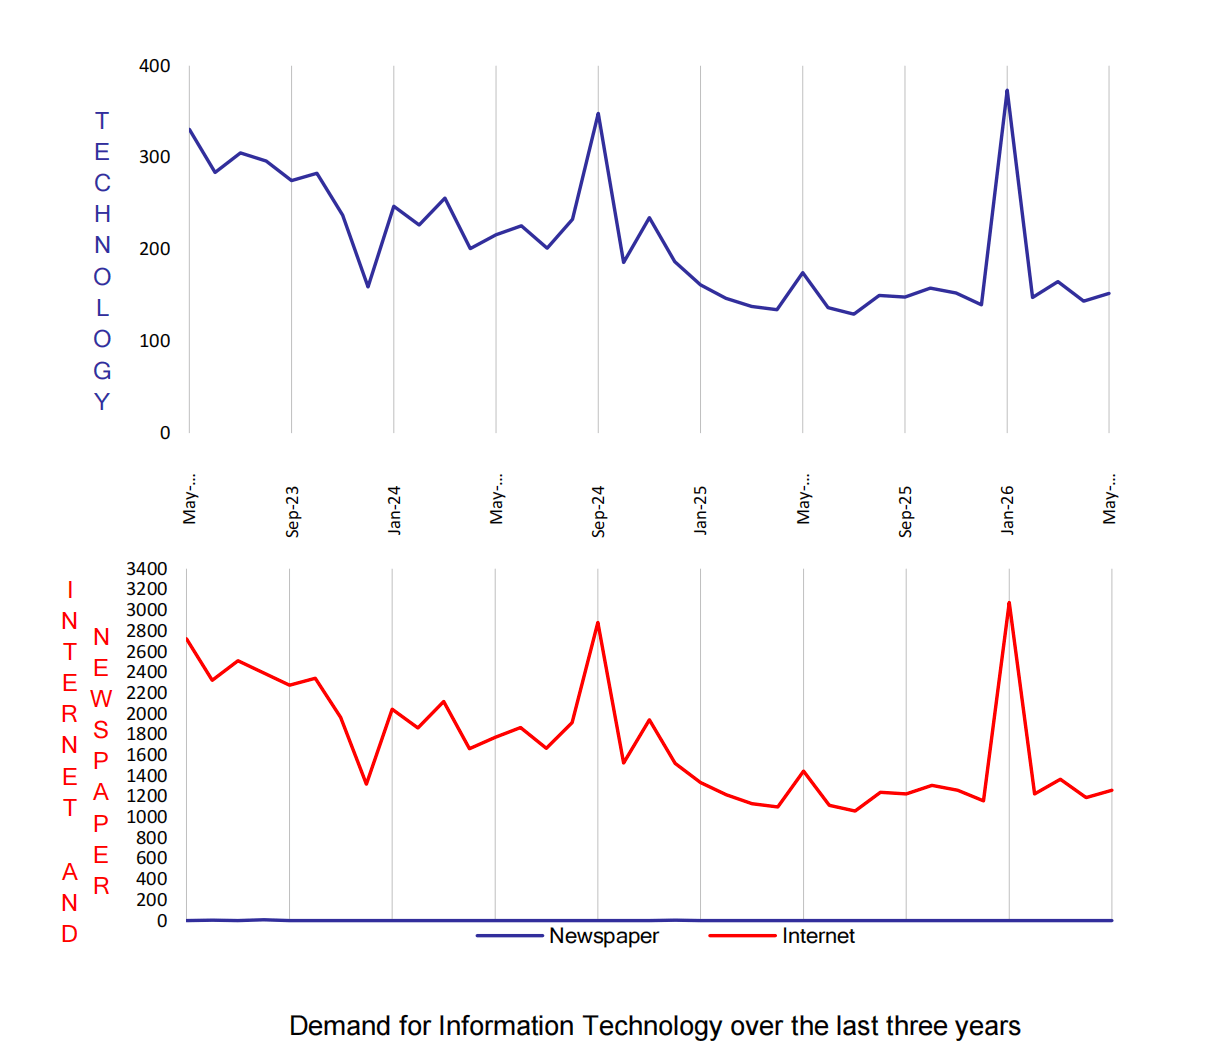
May 2026 E.L Information Technology Index
| May 2026 E.L Information Technology Index: | 152 |
| Same period last year (May 2025): | 175 |
| Percentage change over last month: | 6% |
The losses in the Information Technology sector have seemed to have slowed but shows no sign of positive impetus that would drag it higher. In May – the index gained 6 per cent after the 13 per cent loss of the prior month.
The total improvement depended on the gains made in New South Wales, Western Australia and the ACT, with the ACT powered by gains in the business sector.
Approximately 90 per cent of positions in IT came from the business sector but the government sector is having more of an impact than it was earlier in the year.

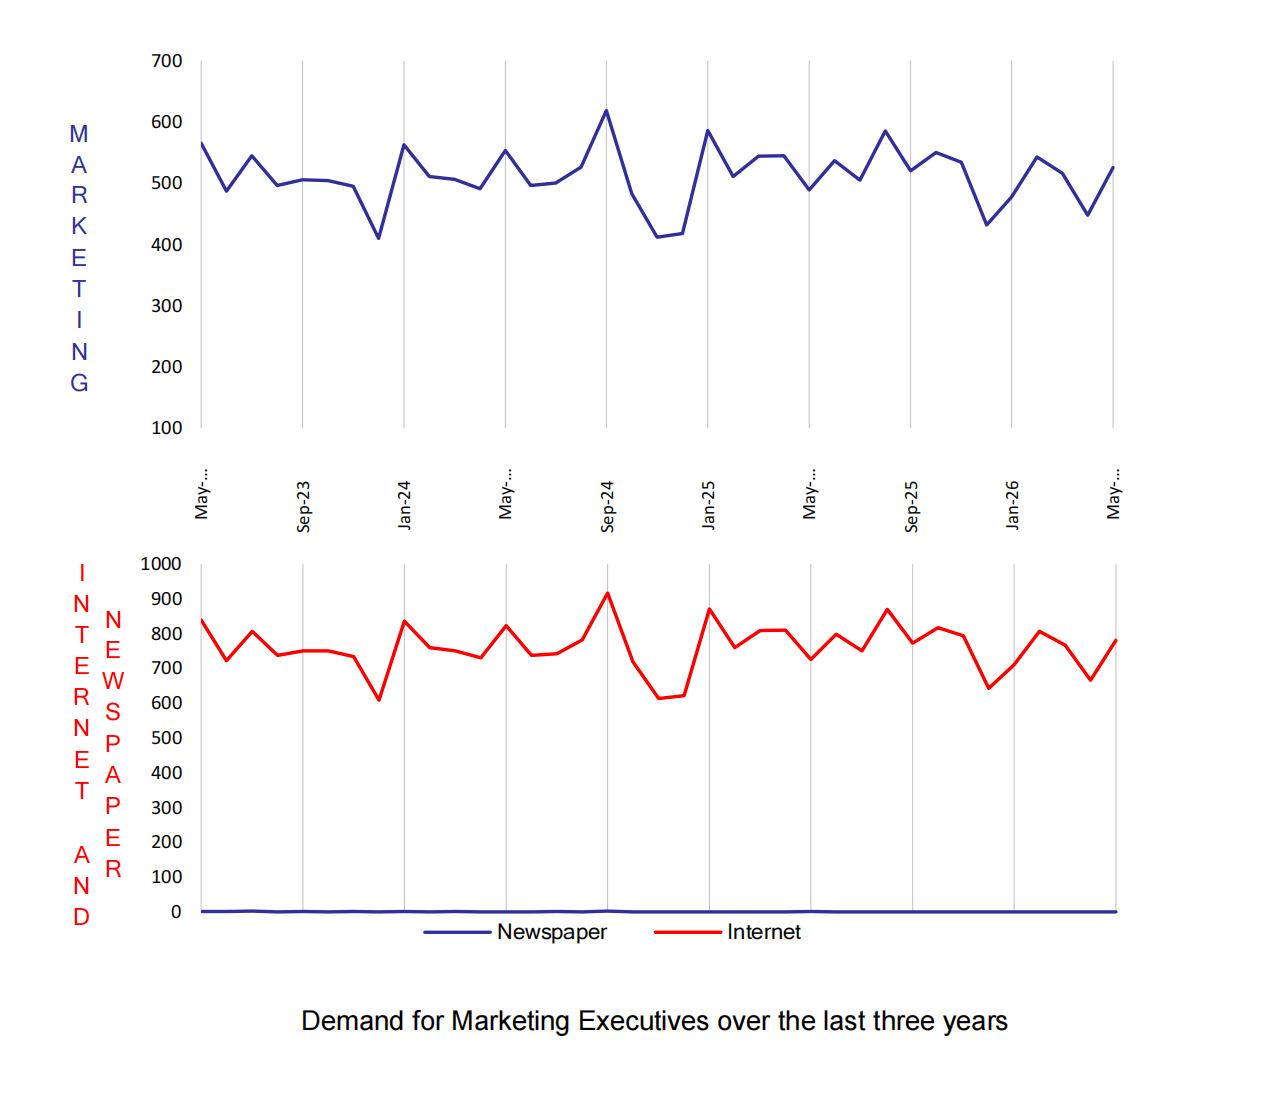
May 2026 E.L Marketing Index
| May 2026 E.L Marketing Index: | 525 |
| Same period last year (May 2025): | 489 |
| Percentage change over last month: | 17% |
The E.L Marketing index picked up 17 per cent over the prior month, meaning it outpointed the loss in April to be one of the few sectors to have registered a bi-month improvement.
The May result was produced by a combination of a strong improvement in New South Wales and backup gains in Victoria and Western Australia. All the gains came in the business sector; the government sector was strongly negative over the month.
While the Marketing index remains relatively flat over the long term, the lack of a definite trend belies the fact that it is very much ahead of the other sectors on a like for like basis. However, it is interesting to note that volatility in the sector has increased in recent months, perhaps indicating that a major move is coming.
About the E.L Index
The E.L Index is a comprehensive monthly analysis of employment trends at executive level. An Australian analysis is produced in Sydney and an Asian analysis in Hong Kong and Singapore.
The E.L Index has shown by two separate University studies to correlate strongly with general economic and business trends. It is featured by most of the major news services and is closely followed by government and central bank analysts.
The E.L Index is actually a combined national index of all executive demand made up of five separate indices; E.L Finance Index, E.L IT Index, E.L Management Index, E.L Marketing Index and the E.L Engineering Index.
The National and specific career group Indexes are shown as relative indexes recording the monthly demand activity for executive positions in the current month against the demand in a historical base period which is normalised to 100. The historical base period used was the average of the last quarter of 1992 which research showed to be the bottom of that downturn.
By averaging to a historical base period the comparison of, say, June 1994 to June 2000 is meaningful, giving a clean, easily understood appreciation of changing investment and economic trends without seasonal obscurity.
The E.L Index utilises data from both print and internet sources and is the only employment index to do so.
The print data is collected from the major employment paper in each state. National papers are not used to avoid “doubling up”. Internet data is not collected off the web sites which can be subject to some error but instead collected through raw data provided by the ISP themselves. Print data has over 15 years of historical data and the internet more than 6 years.
Why Executive Demand is a Primary Lead Indicator?
It is often claimed that unemployment figures and broad-based job vacancy surveys do not give a fair impression of what is occurring in executive ranks. The E.L Index addresses this and has some interesting correlative and predictive qualities. Such as:
- Employment of management usually precedes the employment of skilled and unskilled workers.
- Employment of engineering executives precedes major capital investment.
- The division between various management sectors gives an indication of which sectors of the economy are experiencing growth or decline.
- Compares month by month changes in the public and private sector as well as monitoring government expenditure patterns.
- Makes regional comparisons after allowing for population differences.
- It shows a ‘rate of change’ and can therefore be realistically compared to general economic and employment growth unlike some surveys that report absolute numbers.
- Core data is collected on an actual expenditure of business and government, not on a respondent’s opinion or confidence level.