Executive demand plummeted 6 per cent across Australia even before Middle East conflict – worse is likely to come
The Australian employment market is being hollowed out in the very areas that drive future economic and productivity growth.
The public sector is the only executive demand segment growing, reflecting a government “spend now, tax later” philosophy that continues largely unchecked.
Australian executive demand has started 2026 the same way it ended 2025 – in decline – according to the E.L. Executive Demand Index.
Falls in employment continue.
The E.L. Index fell 6 per cent in February compared with the previous month, with most job sectors, states and territories recording declines as Australia returned to work following the holiday period.
Mr Grant Montgomery, Managing Director of E.L Consult, the executive search firm that has researched and published the E.L. Index for more than 30 years, said the fall was broad- based.
“The E.L. Index fell across every state during February,” Mr Montgomery said.
“The only areas to record growth were the ACT and the Northern Territory, likely reflecting government hiring, as both economies are heavily reliant on public sector spending.”
“The February figures reflect hiring decisions made before the escalation of the Middle Eastern conflict and therefore do not yet capture its impact.”
The worse is yet to come.
“Given the potential effects of a broadening conflict on business confidence, supply chains and resource availability — particularly oil — there is little reason to believe the Australian executive employment market will improve in the near term.”
“For many executives, it is increasingly becoming a choice between working in the public sector or nothing.”
Every sector recorded a decline in February except Marketing, while the largest states — New South Wales, Victoria and Queensland — all experienced significant falls.
Mr Montgomery said increased government spending was unlikely to materially improve executive employment.
“It is difficult to see executive employment and broader economic growth improving simply through governments engaging in large-scale Keynesian-style pump-priming.”
“The problem with government spending — even when directed towards areas like defence
— is that it rarely strengthens the underlying productivity of the economy.”
“It often acts as a short-term sugar hit that is followed by an inevitable comedown.” “And that comedown frequently arrives just as the misuse of funds becomes visible.”
“Think roof insulation programs, school building programs, childcare, aged care, the NDIS — anywhere there is a large pool of money, low barriers to entry and weak oversight, the potential for misuse increases.”
Unemployment can be beneficial,
Mr Montgomery said there may be one unintended benefit of the downturn in executive demand — although it would offer little comfort to job seekers.
“Paradoxically, declining executive employment may help Australia address inflation pressures,” he said.
“In classical Keynesian theory, rising unemployment is one of the few reliable mechanisms for bringing inflation under control.”
“This is particularly relevant today as rising natural resource prices threaten to drive broad cost-push inflation.”
“If public sector wage growth continues — including for nurses, police and other government employees — the risk is that cost-push inflation combines with demand-driven inflation.”
“Really the Reserve Bank has little choice but to respond with higher interest rates.” Mr Montgomery said history provides a warning.
“During the first oil shock of 1973–74, oil prices rose roughly 250 per cent, and Australia’s inflation rate surged to more than 17 per cent within 18 months.”
“As at the time of writing, oil prices had risen approximately 67 per cent in just two weeks.”
“All else being equal — which of course it never is — that could push Australian inflation above 7 per cent before the end of next year.”
Mr Montgomery said the composition of the February result was as concerning as the headline number.
“The decline in the private sectors of NSW and Victoria was significant, while the ACT and Northern Territory — both heavily supported by federal spending — recorded growth.”
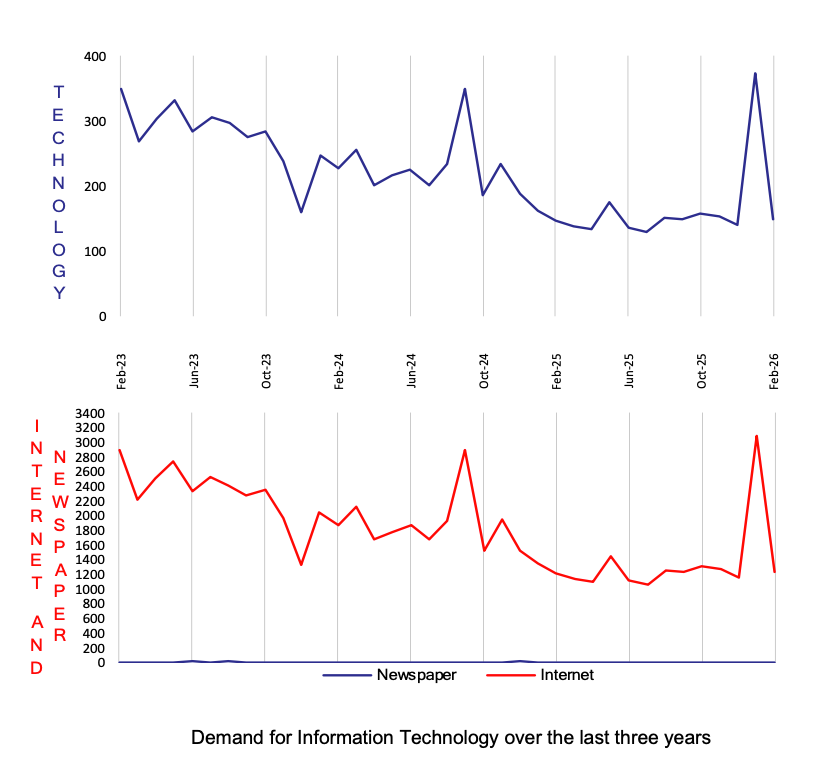
“The worst-performing sector was Information Technology, with a dramatic 80 per cent decline in available executive roles.”
“Unfortunately for Australia, the second-worst performer was Engineering, which closely tracks capital investment activity.”
“As the saying goes, we live in interesting times,” Mr Montgomery said.
Call E.L Blue on +612 9221 6688 or 0414926688 for further details
February 2026 E.L Index National
February 2026 National Index: 487
Same period last year (February 2025): 493
Percentage change over last month: -6%
National Summary
Australian executive demand has started 2026 the same way it ended 2025 – negatively. The E.L Index fell 6 per cent in February compared to the prior month, with most job sectors, states and territories on the decline as Australia got back to serious work after the holiday period. The E.L Index fell in all the states during February, with only the Federal Government-sponsored territories rising.
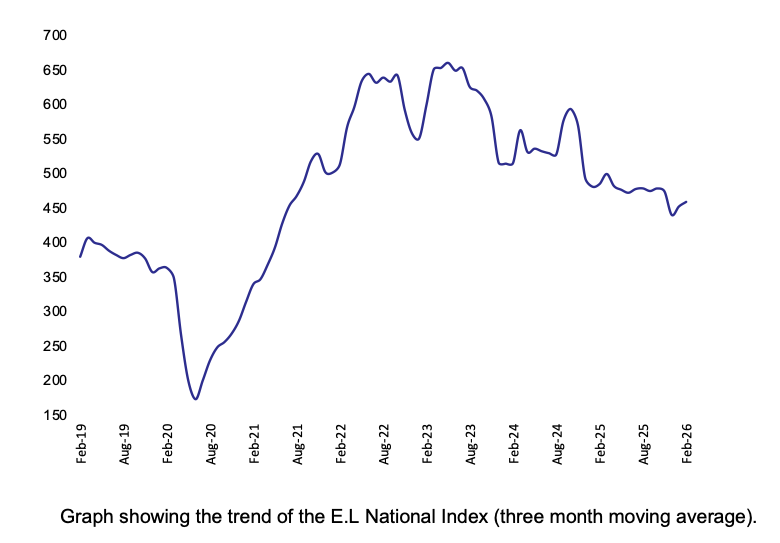
National Demand for Executives over last Seven Years
The executive demand long-term trend continues to fall year on year, with a slight up-tick in a seasonally-affected January starting to be counteracted by the February fall.
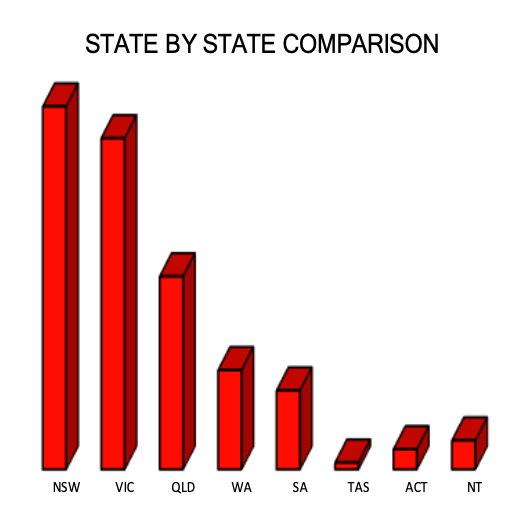
State
All the big eastern seaboard states fell in the month, with NSW and Victoria seeing falls in most market sectors. Queensland also registered a general retraction. The only areas to rise were the ACT and the Northern Territory, likely due to government hiring as these areas live heavily off Federal government spending.
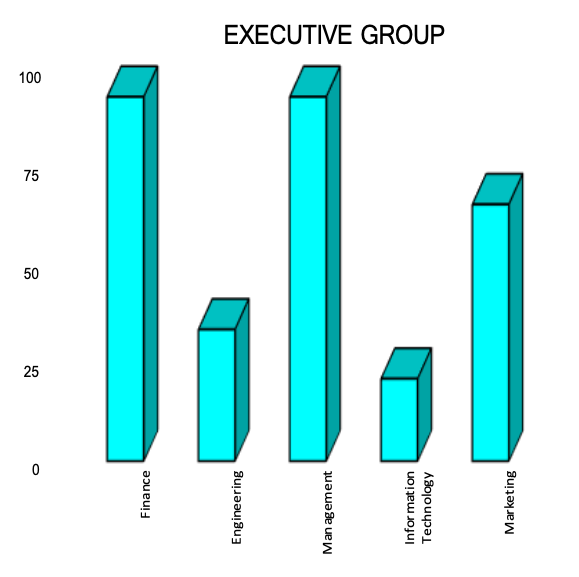
Executive Groups
The worst group was Information Technology with a decline of 80 per cent in the jobs on offer. The second worst performer was Engineering which, due to its close correlation to capital investment, is a bad result in terms of future Australian economic growth and potential productivity improvement.
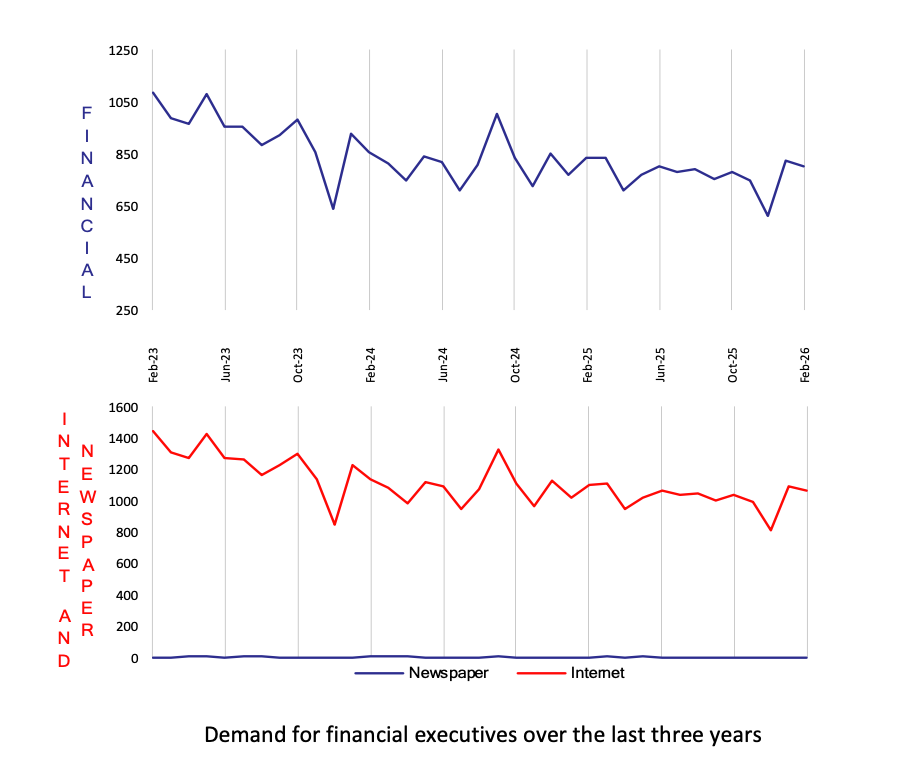
February 2026 E.L Index Finance
February 2026 E.L Finance Index: 802
Same period last year (February 2025): 832
Percentage change over last month: -2%
After a seasonally affected January upward blip, the Financial index fell 2 per cent in February.
All of the large and medium-sized states fell, led by New South Wales, Victoria and Queensland, and joined by Western Australia. The only strong areas were the small regions of Tasmania (off a small base), South Australia, the Northern Territory and the ACT.
All the sectors – print and web, business and government sectors – were down for the month.

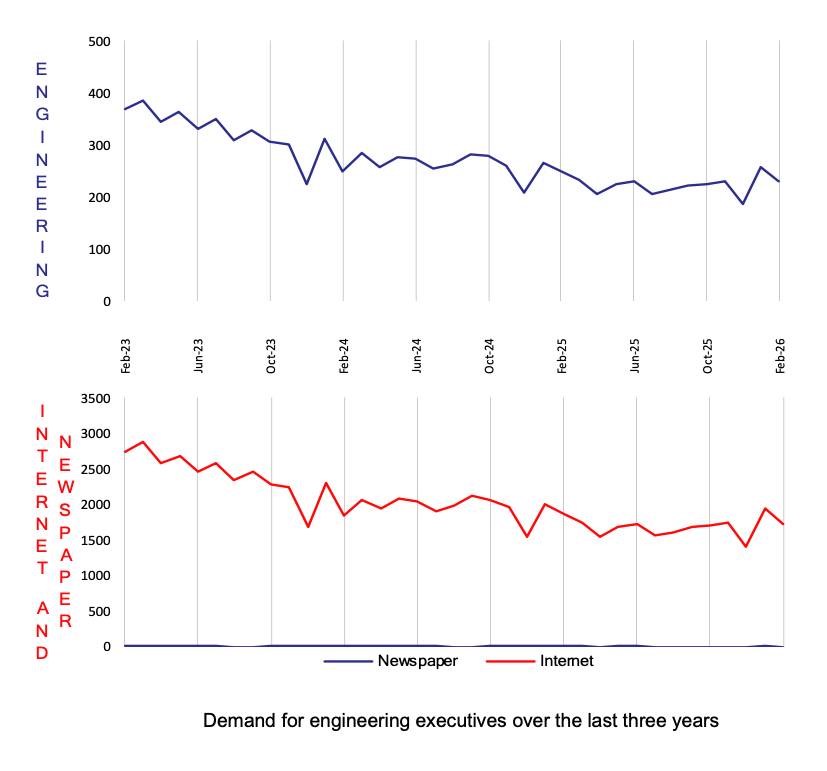
February 2026 E.L Index Engineering
February 2026 E.L Engineering Index: 229
Same period last year (February 2025): 248
Percentage change over last month: -11%
Engineering went solidly down across the country, asking difficult questions as to where future economic growth is going to be sourced.
The only state to see a rise was Queensland; all other regions fell. Underlining the malaise, Engineering was the second market sector to see no positive result in any of its underlying regions.
Again, results were also different across the country, indicating that one-off projects or programs are driving employment rather than general economic strength. South Australia, Western Australia and the Northern Territory all rose, bolstered through government defence associated with spending on future facilities for the nuclear submarines.
The big states were not so lucky and capital expenditure by the business sector continues to be down (although higher in the hot zone of electricity infrastructure linked to AI requirements). The ABS has noted that many large infrastructure programs are coming to an end.

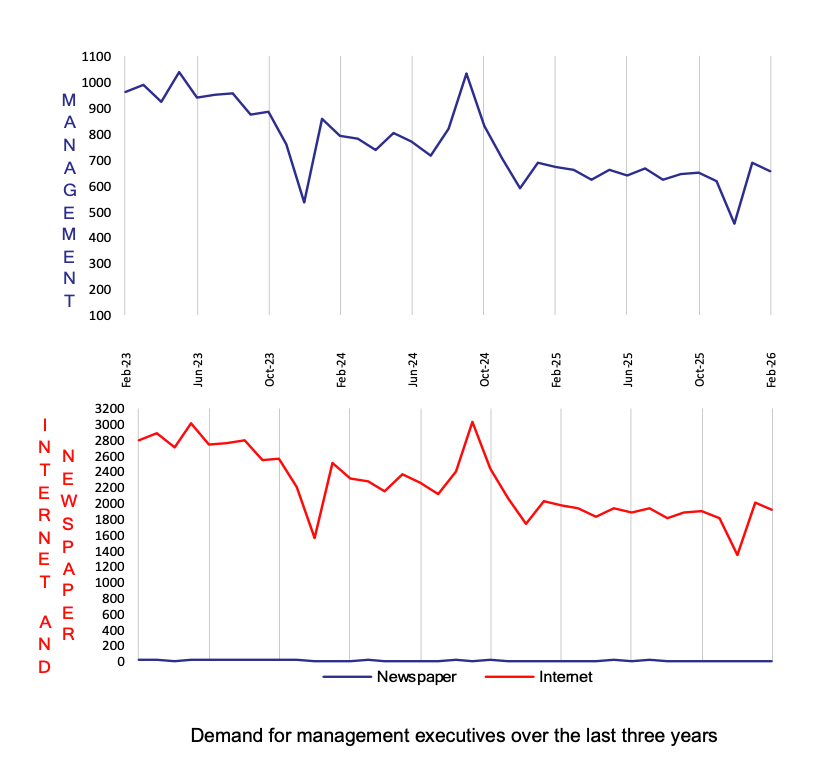
February 2026 E.L Management Index
February 2026 E.L Management Index: 653
Same period last year (February 2025): 673
Percentage change over last month: -5%
Management was another example of the general malaise in employment, seemingly jumping into the Christmas/ summer holiday period early. The Index fell 5 per cent in November.
Significantly, as was the case the prior month, the larger states of New South Wales and Victoria that provide the majority of Management positions provided the most ballast to the overall result, falling 3 and 10 per cent respectively.
The only large state to provide some positive impetus was Queensland, benefiting from gains in the print and web-based business sector.

February 2026 E.L Information Technology Index
February 2026 E.L Information Technology Index: 148
Same period last year (February 2025): 147
Percentage change over last month: -60%
After a full quarter of gains, Information Technology resumed its downward path by registering a 3 per cent loss in November compared to the prior month.
However, recent performances have improved for the sector – not recovering from the prodigious losses in the first half of 2025, but at least stemming the tide and stabilising.
As was the case with most of the sectors in November, performances were region-specific. While New South Wales and Victoria were stronger, Queensland and South Australia were relatively weak.

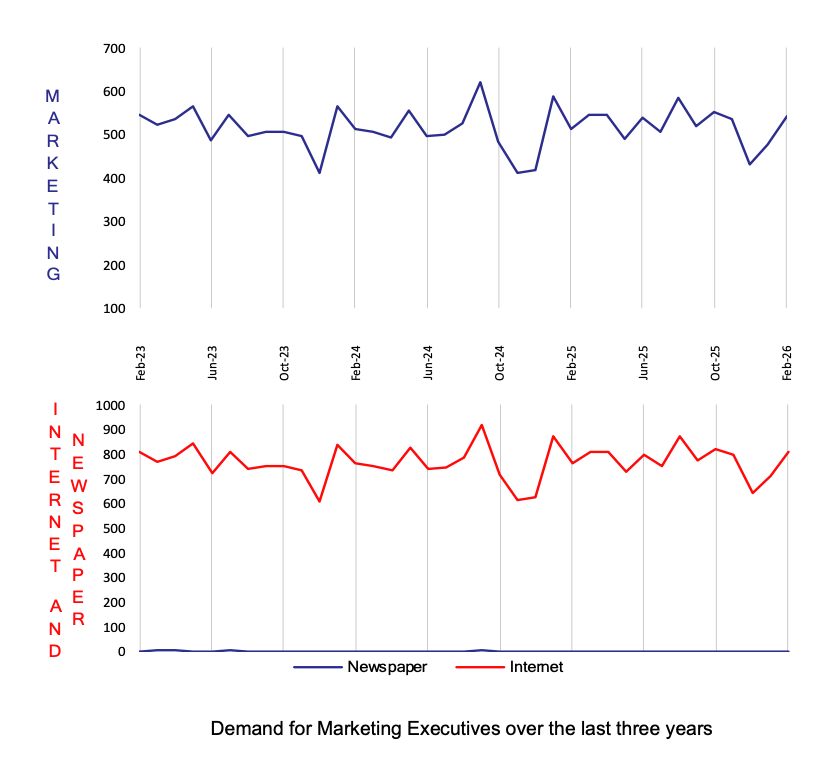
February 2026 E.L Marketing Index
February 2026 E.L Marketing Index: 543
Same period last year (February 2025): 511
Percentage change over last month: 14%
The bifurcation of the Index across the country was visible in Marketing, as New South Wales and the Northern Territory made relatively strong movements higher while all other regions were lower.
It registered an overall 3 per cent loss in November.
Despite the loss, the Marketing index continues to slowly move higher on a longer-term basis – the only sector to do so. It has retained the significant gains made in January 2025 which would normally be pointed at as an anomaly.
New South Wales was again the best large state, offsetting losses in most other regions during the month.

About the E.L Index
The E.L Index is a comprehensive monthly analysis of employment trends at executive level. An Australian analysis is produced in Sydney and an Asian analysis in Hong Kong and Singapore.
The E.L Index has shown by two separate University studies to correlate strongly with general economic and business trends. It is featured by most of the major news services and is closely followed by government and central bank analysts.
The E.L Index is actually a combined national index of all executive demand made up of five separate indices; E.L Finance Index, E.L IT Index, E.L Management Index, E.L Marketing Index and the E.L Engineering Index.
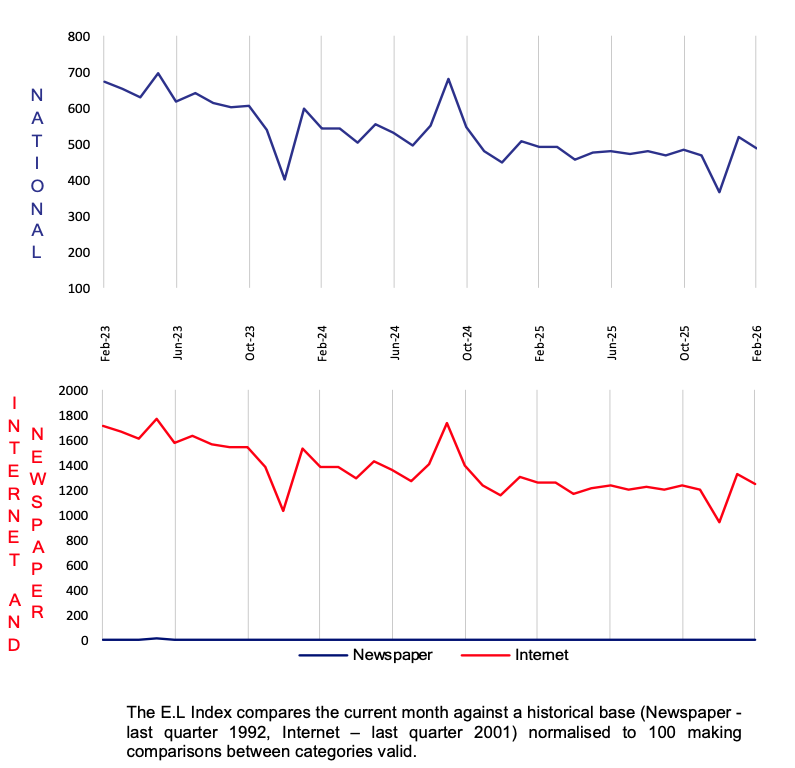
The National and specific career group Indexes are shown as relative indexes recording the monthly demand activity for executive positions in the current month against the demand in a historical base period which is normalised to 100. The historical base period used was the average of the last quarter of 1992 which research showed to be the bottom of that downturn.
By averaging to a historical base period the comparison of, say, June 1994 to June 2000 is meaningful, giving a clean, easily understood appreciation of changing investment and economic trends without seasonal obscurity.
The E.L Index utilises data from both print and internet sources and is the only employment index to do so.
The print data is collected from the major employment paper in each state. National papers are not used to avoid “doubling up”. Internet data is not collected off the web sites which can be subject to some error but instead collected through raw data provided by the ISP themselves. Print data has over 15 years of historical data and the internet more than 6 years.
Why Executive Demand is a Primary Lead Indicator?
It is often claimed that unemployment figures and broad-based job vacancy surveys do not give a fair impression of what is occurring in executive ranks. The E.L Index addresses this and has some interesting correlative and predictive qualities. Such as:
- Employment of management usually precedes the employment of skilled and unskilled workers.
- Employment of engineering executives precedes major capital investment.
- The division between various management sectors gives an indication of which sectors of the economy are experiencing growth or decline.
- Compares month by month changes in the public and private sector as well as monitoring government expenditure patterns.
- Makes regional comparisons after allowing for population differences.
- It shows a ‘rate of change’ and can therefore be realistically compared to general economic and employment growth unlike some surveys that report absolute numbers.
- Core data is collected on an actual expenditure of business and government, not on a respondent’s opinion or confidence level.