

Executive employment in Australia is becalmed as the economy rushes to the bottom with some of highest inflation and unemployment in the OECD
AI is not the saviour
There are no signs of recovery in the employment market after recent significant falls, according to the E.L. Executive Demand Index.
Mr Grant Montgomery, Managing Director of leading search firm, E.L Consult, said: “One in four Australian executive positions advertised have disappeared in the past five months.”
“Usually there is some kind of bounce back – that is what we have seeing in the over 30 years of researching and publishing the EL Index – but there has not being any significant bounce in 2026,” Mr Montgomery said.
“Every economic downturn is different and this one is no exception.
“As we stay on course for a recession falling demand for executives is as expected, but this time there are no positive signs of a revival and where any revival might come from.
“Financial executives are seeing some new jobs on offer – which is not unusual as in these times businesses require some deep financial analysis to focus on cost cutting and shoring up their borrowing capacity.
“Particularly disappointing is Engineering positions as demand in this sector correlates directly with capital investment which is clearly tanking.
“Although equity markets are near their highs and capital spending on the surface in Australia is high, both of those signals are very specific in nature and aren’t translating to the real economy which employs executives.
The most significant gains were made in IT positions as Australia follows the AI boom
“In financial markets it is the AI boom, in Australia it is capital expenditure in the telecommunications industry.
There is so much hype in circulation about AI is it any wonder that this month saw massive rises in positions with Information and Communications Technology rising 18 per cent after significant gains last month.
Many observers see the hype as exactly that “hype” while businesses and public sector need to show they are up to date by incorporating AI gains in their web site and presentations to the there is very little sign that AI is actually improving products let alone productivity.
At some time someone is going to say the emperor has no clothes and we could be looking at another ‘tech wreck”.
The stats don’t drill down very far but it would be fair to say, what with the cratering in property investment and higher interest rates mean that corporate funding is harder to come by, that again it is data centres that are being built before anything else.
“A financial AI boom is, for the moment, likely to garner profits for US tech ‘bro’s’, and a physical boom in data centres is likely to be a flash in the pan.
“It now seems like Australia is under attack with high taxes and falling productivity being defended by US businesses in AI without having a very strong AI industry of our own.
“Hopefully things will improve but we doubt it will happen anytime soon – productivity improvement measures again seemed to have taken the back seat on the bus.
“And with political parties of all stripes now finally signing on to the idea that immigration has to fall, economic growth potential from that avenue is also likely to be cut off.
For the second consecutive month, the E.L. Executive Demand Index in September was flat compared to the prior month
“Executive employees are clearly living in the hope of an AI induced boom which means that any executive who doesn’t now mention AI on their resume is going to be unemployed for quite some time.
“Note that executives are the ones with the highest mortgages and bearing the brunt of the high spending induced inflation and subsequent interest rate increases,” Mr Montgomery said.
Among the industry groups in September, the Information Technology sector saw the largest percentage gain off a small base, followed by Financial and Management. Marketing and Engineering both fell.
Among the states and territories, The most significant move was a gain in Western Australia off the back of a broad-based demand uptick.
New South Wales was the only other region to record a rise, while the largest drop was recorded in the ACT as management positions fell.
Call Grant Montgomery on +612 9221 6688 or email el@el.au for further contact
| September 2026 National Index: | 372 |
| Same period last year (September 2025): | 469 |
| Percentage change over last month: | 0 |
National Summary
Australian executives have seen no signs of recovery in their employment market after recent significant falls, with the EL Index again remaining flat in September compared to the prior month. This contrasts with the usual “movement then pull-back” style the EL Index has experienced over more than 30 years. Signs of growth seem to be very specific in nature and are therefore not translating to the broader economy that employs executives.
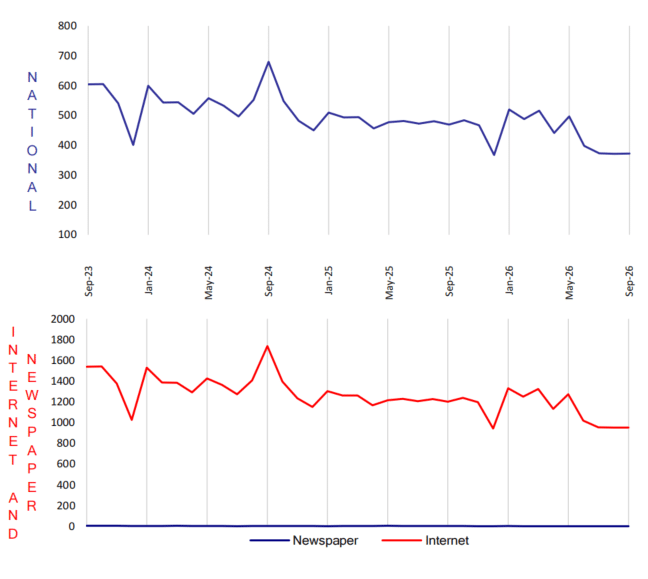

National Demand for Executives over last Seven Years
It would seem that the national executive demand trend is moving closer to levels last seen in 2019 before the bust then boom of the Covid era. However, while demand is getting closer to 2019 levels, the number of executives out there is now higher, which puts executive employment under significant pressure.
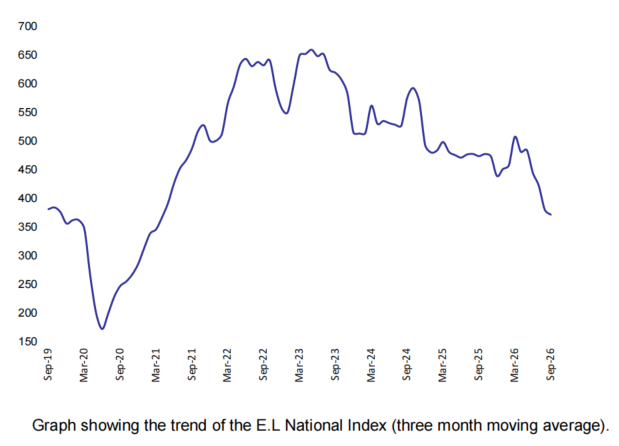
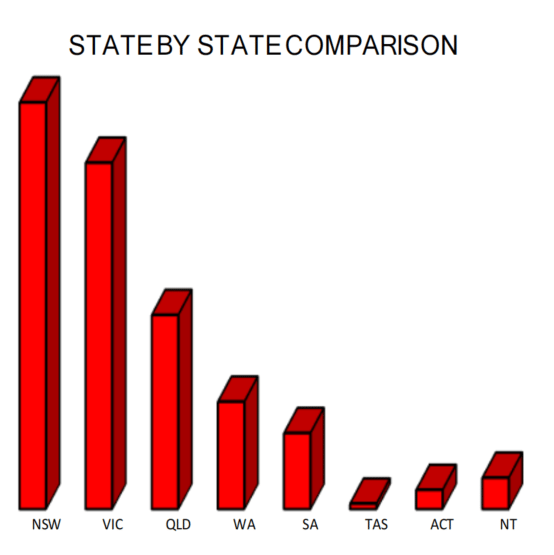
State
Financial and IT positions drove a 5 per cent rise in NSW Victoria fell 4 per cent, most of it in Marketing. All five groups rose in WA with Marketing making the largest contribution to its 19 per cent gain. The ACT fell 28 per cent off a small base after its business sector Management.
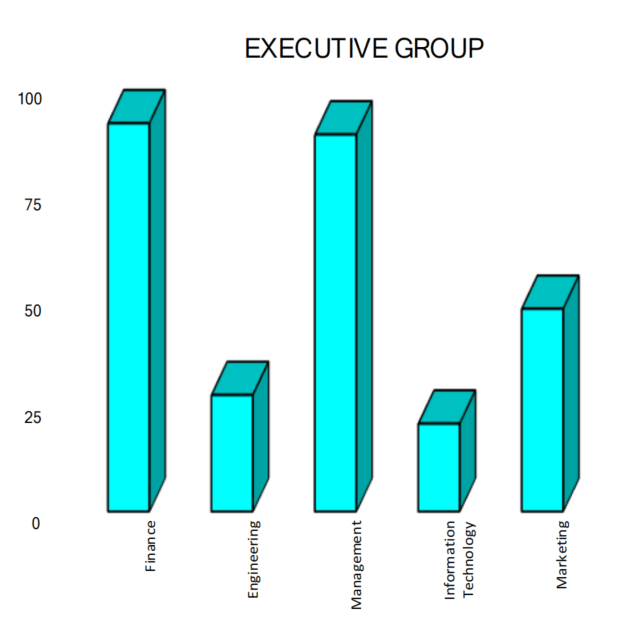
Executive
All sectors were positive except for private sector management positions. There were significant increases in the financial sector for New South Wales government positions. Other significant gains included the Tasmanian and ACT Marketing. (no doubt pushed up by their resources sector)
September 2026 E.L Finance Index
| September 2026 E.L Finance Index: | 660 |
| Same period last year (September 2025): | 751 |
| Percentage change over last month: | 4% |
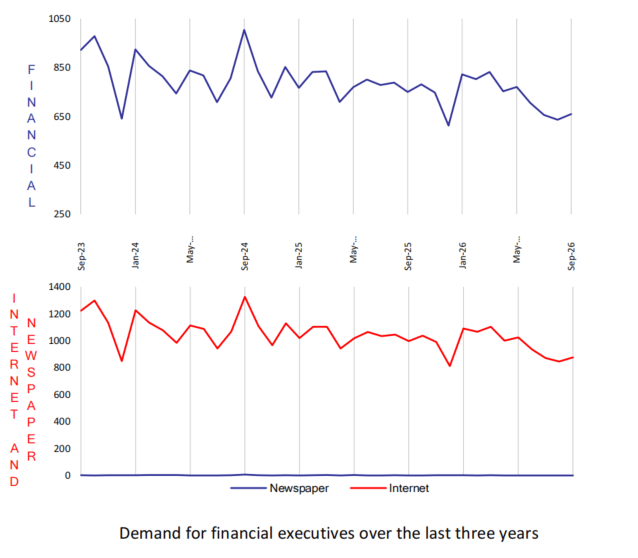
The Financial index rose 4 per cent, its first gain since May, as companies look to lock in longer term funding amid higher interest rates. Business sector positions supplied the rise while government demand was little changed off a small base.
New South Wales rose strongly, adding more positions than in the rest of the country put together. As in other sectors this month, Western Australia also rose. Queensland fell 10 per cent and South Australia slipped.
The gain does little to the longer picture. Outside the December holiday troughs, the past three months are the lowest readings in three years.
Demand for financial executives over the last three years

September 2026 E.L Engineering Index
| September2026 E.L Engineering Index: | 187 |
| Same period last year (September 2025): | 223 |
| Percentage change over last month: | -7% |
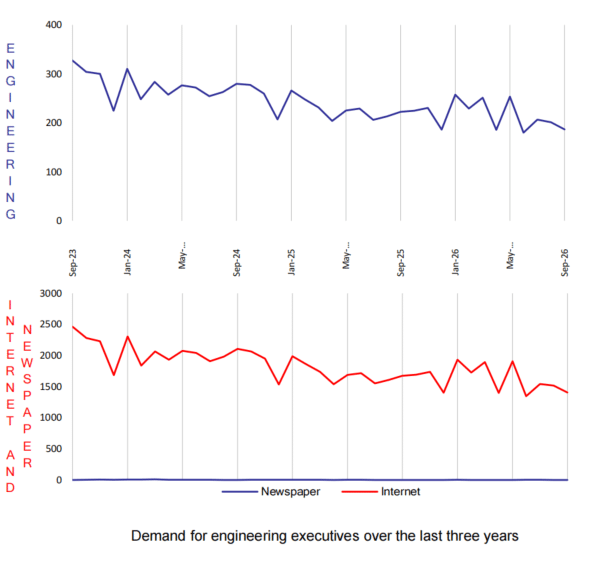
Engineering fell 7 per cent and is back near its April level. Business sector positions fell the most while government demand rose off a small base.
New South Wales fell 15 per cent and accounted for most of the national decline. South Australia also lost ground while Western Australia and Victoria edged higher.
The large swings of April to June have given way to a steadier slide. The index has eased in each of the past two months and now sits close to the bottom of a three-year range that has drifted down since late 2023.

September 2026 E.L Management Index
| September 2026 E.L Management Index:: | 469 |
| Same period last year (ASeptember 2025): | 642 |
| Percentage change over last month: | 1% |
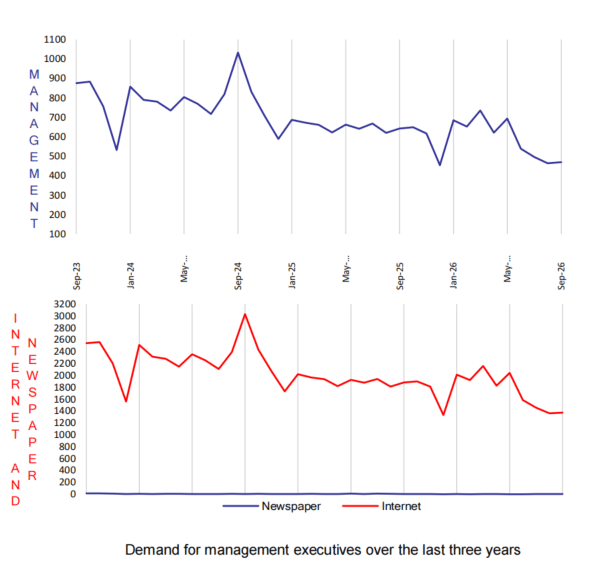
Management rose a slim 1 per cent, its first rise since May. Business sector positions edged up and government demand fell.
New South Wales rose 7 per cent and Queensland 6 per cent. Those two states carried the national gain. Victoria and the ACT were lower.
Interestingly, five Management roles were advertised in print media in the month, three in the Victorian business sector.

September 2026 E.L Information Technology Index
| September2026 E.L Information Technology Index: | 145 |
| Same period last year (September 2025): | 148 |
| Percentage change over last month: | 18% |
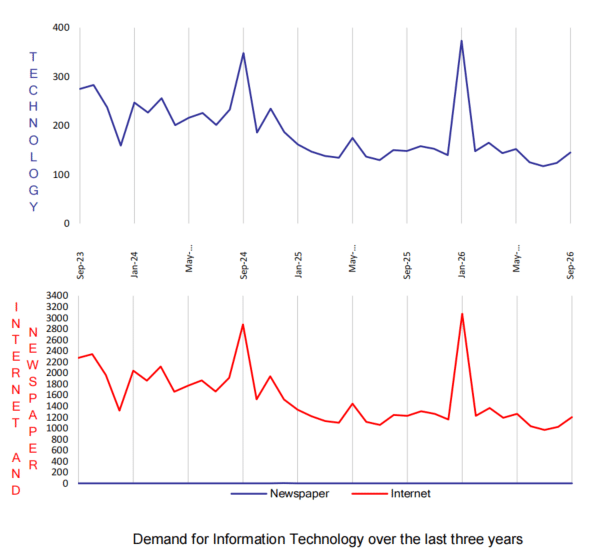
There is so much hype in circulation about AI is it any wonder that this month saw massive rises in positions with Information and Communications Technology rising 18 per cent after significant gains last month.
Many observers see the hype as exactly that “hype” while businesses and public sector need to show they are up to date by incorporating AI gains in their web site and presentations to the there is very little sign that AI is actually improving product let alone productivity
At some time someone is going to say the emperor has no clothes and we could be looking at another ‘tech wreck”.
New South Wales rose sharply to supply most of the national increase. Western Australia also gained off a small base. Queensland and the ACT were lower.
The this ndex is now close to where it was a year ago, whereas no other group is within 10 per cent of that.

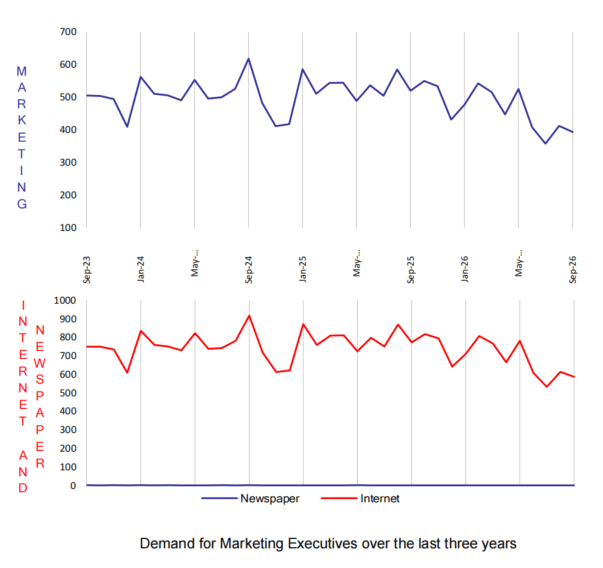
September 2026 E.L Marketing Index
| September 2026 E.L Marketing Index: | 394 |
| Same period last year (September 2025): | 520 |
| Percentage change over last month: | -4% |
Marketing fell 4 per cent and gave back about a third of August’s gains. The fall came from the business sector, with the government sector contribution negligible.
New South Wales’ fall and Victoria’s larger percentage decrease set the tone for the overall result. Western Australia rose off a small base.
The Marketing index remains close to its July result which was the lowest in at least three years. The saw-tooth trading pattern since then has run below most of the 2024 and 2025 readings

About the E.L Index
The E.L Index is a comprehensive monthly analysis of employment trends at executive level. An Australian analysis is produced in Sydney and an Asian analysis in Hong Kong and Singapore.
The E.L Index has shown by two separate University studies to correlate strongly with general economic and business trends. It is featured by most of the major news services and is closely followed by government and central bank analysts.
The E.L Index is actually a combined national index of all executive demand made up of five separate indices; E.L Finance Index, E.L IT Index, E.L Management Index, E.L Marketing Index and the E.L Engineering Index.
The National and specific career group Indexes are shown as relative indexes recording the monthly demand activity for executive positions in the current month against the demand in a historical base period which is normalised to 100. The historical base period used was the average of the last quarter of 1992 which research showed to be the bottom of that downturn.
By averaging to a historical base period the comparison of, say, June 1994 to June 2000 is meaningful, giving a clean, easily understood appreciation of changing investment and economic trends without seasonal obscurity.
The E.L Index utilises data from both print and internet sources and is the only employment index to do so.
The print data is collected from the major employment paper in each state. National papers are not used to avoid “doubling up”. Internet data is not collected off the web sites which can be subject to some error but instead collected through raw data provided by the ISP themselves. Print data has over 15 years of historical data and the internet more than 6 years.
Why Executive Demand is a primarily lead indicator?
It is often claimed that unemployment figures and broad-based job vacancy surveys do not give a fair impression of what is occurring in executive ranks. The E.L Index addresses this and has some interesting correlative and predictive qualities. Such as:
- Employment of management usually precedes the employment of skilled and unskilled workers.
- Employment of engineering executives precedes major capital investment.
- The division between various management sectors gives an indication of which sectors of the economy are experiencing growth or decline.
- Compares month by month changes in the public and private sector as well as monitoring government expenditure patterns.
- Makes regional comparisons after allowing for population differences.
- It shows a ‘rate of change’ and can therefore be realistically compared to general economic and employment growth unlike some surveys that report absolute numbers.
- Core data is collected on an actual expenditure of business and government, not on a respondent’s opinion or confidence level.