Executive jobs plumet
Executive employment slumps 14pc in April as slowdown broadens.
EL Index points to rising stagflation with recession no longer a remote risk
Australian executive hiring fell sharply in April, with the E.L. Executive Demand Index dropping 14 per cent month-on-month — the steepest decline outside pandemic disruptions.
The fall was broad-based, spanning both private and public sectors and almost all regions, signalling an entrenched slowdown in labour demand at the senior level.
E.L Consult CEO Grant Montgomery said the E.L Index data, a lead index, pointed to a material deterioration in economic conditions.
“The struggling executive jobs market has fallen off a cliff.
“And this is certainly not good for middle management with the lion’s share of mortgage debt now being hit further with another RBA interest rate rise.
“Behind the EL Index’s 14 per cent fall there were declines recorded in every state and territory except Tasmania,” Mr Montgomery said.
“New South Wales, Victoria and Queensland all posted significant falls, while the smaller states — South Australia, Western Australia and the Northern Territory — experienced even sharper contractions.”
“The results suggest the executive labour market, an excepted lead indicator of business confidence and investment, is rapidly weakening.
“The Australian economy has been in trouble for some time but the continuing instability internationally combined higher input prices and a reduction in consumer demand, has finally pricked the employment bubble.
“High government spending has not helped either and collapsed productivity and, the odd war or two internationally, has left a toll.
“It’s not looking good for the Australian economy into the future, and it is doubtful the heavily anticipated big taxing Budget this month will help anything.
“We are a resilient lot but just how much can a koala bear?”
Mr Montgomery said the higher input costs, weaker consumer demand and ongoing geopolitical instability are now feeding through more clearly into employment hiring decisions,” he said.
“Government spending has not offset the decline, and the continuously declining productivity levels is very evident in the country’s economic performance.”
“It is very clear the outlook is deteriorating. Mr Montgomery said
“Stagflation conditions are increasingly and a recession, can no longer considered unlikely,”.
Sector and regional detail
New South Wales and Victoria recorded declines in the mid-teens, with Queensland also down by double digits.
Smaller jurisdictions were more volatile, with South Australia, Western Australia and the Northern Territory all posting sizeable falls. The ACT recorded the largest single decline following recent gains, with both public and private sector demand weakening.
By sector, Engineering led the downturn, with losses concentrated in the eastern states and Western Australia. Declines were evident across both government and private sector roles, pointing to weaker momentum in infrastructure and investment activity.
Further falls were recorded across Management, Information Technology, Marketing and Financial Services, indicating a broad-based pullback rather than sector-specific weakness.
Tasmania was the only state to record an increase, driven by a small rise in management roles, although the result may reflect short-term volatility of the relatively small economy rather than a sustained shift.
Call E.L Blue on +612 9221 6688 or 0414926688 for further details
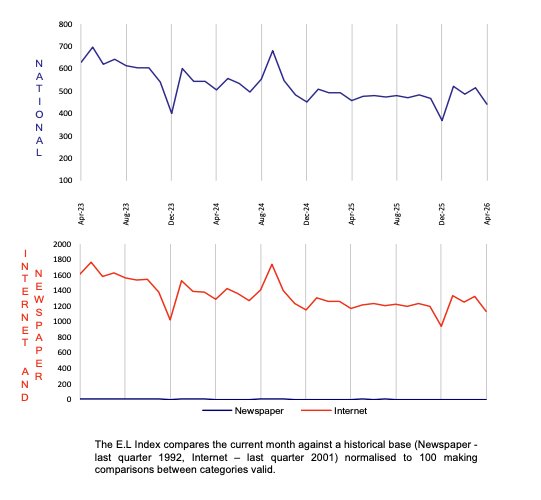
April 2026 E.L Index National
| April 2026 National Index: | 441 |
| Same period last year (April 2025): | 457 |
| Percentage change over last month: | -14% |
National Summary
The E.L Index plunged 14 per cent in April compared to the prior month – the largest one-month fall in a non-holiday affected month since at least the Covid disruptions.
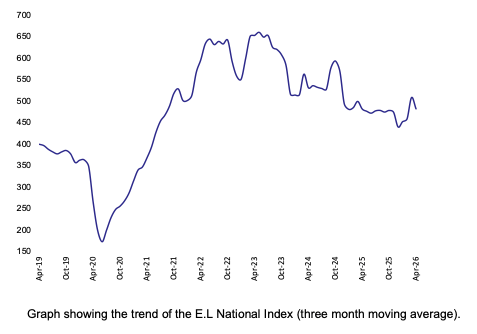
National Demand for Executives over last Seven Years
The executive demand long-term trend has taken a hook turn with the big fall in April. If there is no significant pick up in May, the downward draft will continue.
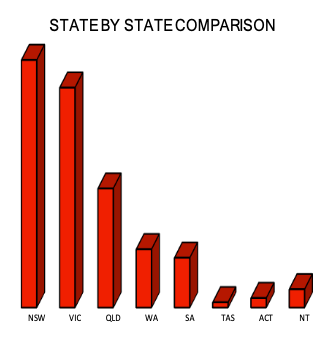
State
The largest states of NSW and Victoria produced losses in the mid-teens and Queensland also had a double-digit loss. SA, WA and the NT also had sizable losses. After two months of strong performances, the ACT recorded the largest fall in the country both in public and private sector jobs.
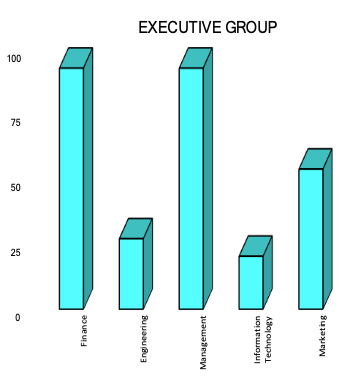
Executive
The losses among the industry groups were led by Engineering, which was concentrated in NSW, Victoria and, to a lesser extent, WA. Engineering was followed in its losses by Management, IT, Marketing, Finance. Other significant gains included the Tasmanian and ACT Marketing.
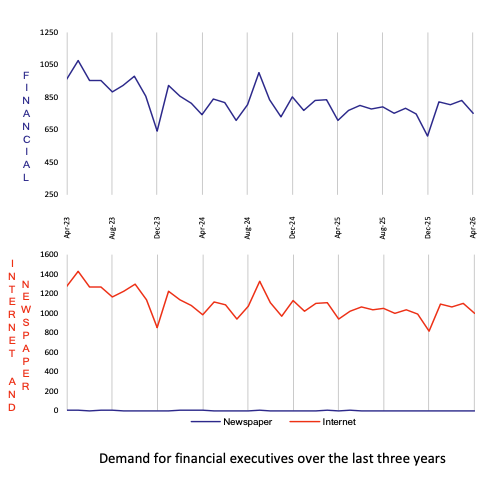
April 2026 E.L Index Finance
| April 2026 E.L Finance Index: | 752 |
| Same period last year (April 2025): | 709 |
| Percentage change over last month: | -10% |
The Financial index’s trend took a serious dip in April, disrupted by a 10 per cent decrease compared with the prior month.
The Financial sector did echo the general reductions in demand seen across the Index, with most states and territories falling significantly. However, the overall Index was saved by an outlier – New South Wales eked out a scant 1 per cent gain, enough to add some positive impetus and limit the sector’s overall loss.
New South Wales, in turn, was saved by a significant rise in web-based business sector positions, possibly as the sector winds up for the end of year accounting efforts.

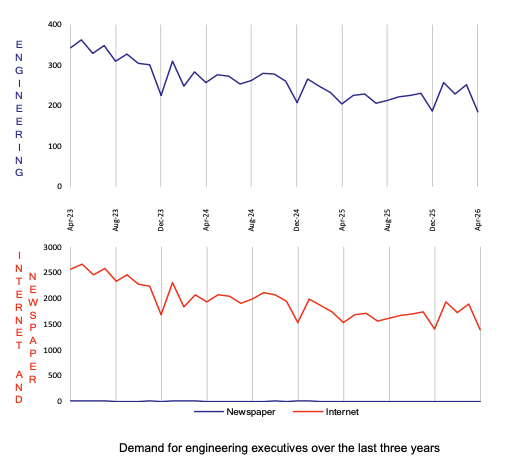
April 2026 E.L Index Engineering
| April 2026 E.L Engineering Index: | 186 |
| Same period last year (April 2025): | 204 |
| Percentage change over last month: | -26% |
Engineering has dropped to a record low, underlying the capital investment challenges facing Australia and sending worrying signals about the economy’s future performance. The Engineering index fell 26 per cent in April.
Engineering was showing some signs of recovery, or at least a flattening of its negative trend, but the performance in April has clearly undermined that. The Engineering index saw significant reductions in all regions except for the Northern Territory, led, in percentage terms, by the largest states of New South Wales and Victoria.
Both New South Wales and Victoria suffered decreases in the business and government web-based advertising areas; on the print side advertising remain flat.

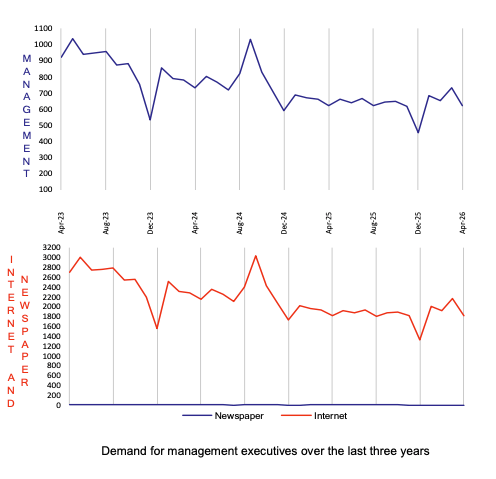
April 2026 E.L Management Index
| April 2026 E.L Management Index: | 621 |
| Same period last year (April 2025): | 622 |
| Percentage change over last month: | -15% |
Despite the 15 per cent loss in April, Management remains in its recent trading range due to the improvements registered in the first months of 2026.
Since April 2023, at the back end of the Covid panic, the Management index has lost approximately 40per cent of its demand. This is despite the government sector continuing to spend on management positions, emphasising the hollowing out of management positions, or at least pure management positions, in the business sector. This demonstrates a dichotomy of approach in the basic running of organisations in 2026.
Like the other sub-indexes in April, the losses were widespread. The ACT took the biggest impact, where there was a reduction in positions advertised in both the government and business sectors. Western Australia recorded the largest reduction among the largest states, while the smaller regions of Tasmania and the Northern Territory registered gains of relatively small basis.

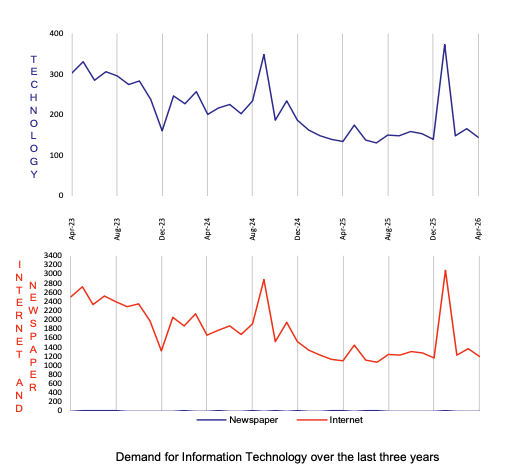
April 2026 E.L Information Technology Index
| April 2026 E.L Information Technology Index: | 144 |
| Same period last year (April 2025): | 134 |
| Percentage change over last month: | -13% |
The recovery in the Information Technology sector has had the brakes put on with the index falling 13per cent compared to the prior month. Relatively speaking, this result puts information technology in the middle of the sectoral bunch losing more than the Financial index but recording the same result as Marketing and beating the Engineering and Management sectoral results.
However, given the amount of volatility historically in this sector, the April result raises questions on where the future lies for demand in this sector given that the rise of artificial intelligence has allowed non-coders to become more hands-on in the information technology space, reducing the number of executives required to look after what were specialist roles.
Western Australia was the most affected by the downdraft due to a significant retraction in private sector positions. In fact, the reductions in demand in Information Technology were specific than in other sectors. In what was an overall difficult month, four of the eight regions finished the month in positive territory.

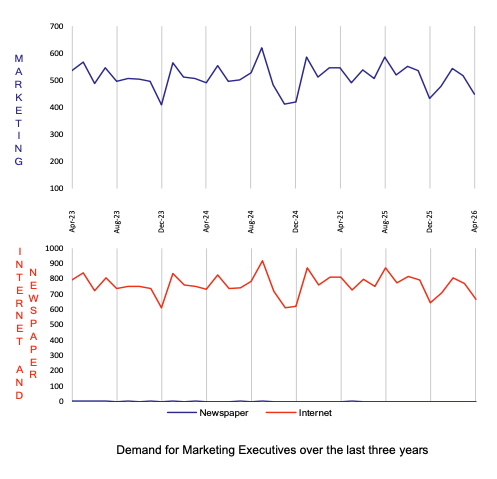
April 2026 E.L Marketing Index
| April 2026 E.L Marketing Index: | 448 |
| Same period last year (April 2025): | 545 |
| Percentage change over last month: | -13% |
Apart from Information Technology, where its percentage movements are exaggerated by the relatively small amount of jobs on offer, the Marketing index was again the best-performing of the sector indices, gaining 7 per cent versus the prior month.
The gains were quite widespread across the larger states, particularly New South Wales, Victoria and the ACT. Queensland’s losses were mainly concentrated in the government sector but were minor compared with the overall gains in the other regions.
Both web and print advertising rose over the month, with internet-based ads producing most of the impetus for the positive result.

About the E.L Index
The E.L Index is a comprehensive monthly analysis of employment trends at executive level. An Australian analysis is produced in Sydney and an Asian analysis in Hong Kong and Singapore.
The E.L Index has shown by two separate University studies to correlate strongly with general economic and business trends. It is featured by most of the major news services and is closely followed by government and central bank analysts.
The E.L Index is actually a combined national index of all executive demand made up of five separate indices; E.L Finance Index, E.L IT Index, E.L Management Index, E.L Marketing Index and the E.L Engineering Index.
The National and specific career group Indexes are shown as relative indexes recording the monthly demand activity for executive positions in the current month against the demand in a historical base period which is normalised to 100. The historical base period used was the average of the last quarter of 1992 which research showed to be the bottom of that downturn.
By averaging to a historical base period the comparison of, say, June 1994 to June 2000 is meaningful, giving a clean, easily understood appreciation of changing investment and economic trends without seasonal obscurity.
The E.L Index utilises data from both print and internet sources and is the only employment index to do so.
The print data is collected from the major employment paper in each state. National papers are not used to avoid “doubling up”. Internet data is not collected off the web sites which can be subject to some error but instead collected through raw data provided by the ISP themselves. Print data has over 15 years of historical data and the internet more than 6 years.
Why Executive Demand is a Primary Lead Indicator?
It is often claimed that unemployment figures and broad-based job vacancy surveys do not give a fair impression of what is occurring in executive ranks. The E.L Index addresses this and has some interesting correlative and predictive qualities. Such as:
- Employment of management usually precedes the employment of skilled and unskilled workers.
- Employment of engineering executives precedes major capital investment.
- The division between various management sectors gives an indication of which sectors of the economy are experiencing growth or decline.
- Compares month by month changes in the public and private sector as well as monitoring government expenditure patterns.
- Makes regional comparisons after allowing for population differences.
- It shows a ‘rate of change’ and can therefore be realistically compared to general economic and employment growth unlike some surveys that report absolute numbers.
- Core data is collected on an actual expenditure of business and government, not on a respondent’s opinion or confidence level.