
Executive job market in Australia roars back to life.
Better news for employees but not for those with high mortgages
Demand for Executive Positions in Australia in June 2024
The executive job market took back some of its recent losses this month as government hiring and the end of the financial year prompted increased demand, according to the E.L. Executive Demand Index.
The E.L Index rose 10 per cent in May, responding to three consecutive months of prior losses.
Mr Grant Montgomery, Managing Director of E.L Consult the leading human resources consultancy which has researched and published the E.L. Executive Demand Index for over 30 years, said: “This month the E.L Index roared back to life.
“With strong hiring by the federal government and the traditional pre-financial year end hiring of finance executives the E.L Index has risen.
“The gains were across all sectors and most states and territories.
Challenges in the Job Market
“It is not all good news, however – total hiring is dramatically down on this time last year and a long way from the activity of 2 years ago.”
“In fact, the E.L Index is 20 per cent lower than a year ago.”
“In 2021 and 2022 there were shortages of positions during Covid that embellished job demand and wage levels and since then, the executive job market has been on a long-term, slow, decline.”
“Now, in 2024, we have inflation that was built into the system by a long line of wage and price rises during and just after Covid and of course significantly higher interest rates.”
“Despite the pain being created by the current high interest rates, inflation is also remaining doggedly high and the jobs market, particularly in the labour-intensive services sector, is putting upward pressure on this inflation.”
Interest Rate Remain Unsettled
“As a result, further interest rate hikes cannot be ruled out.”
“Compounding this the other big issue of overseas migration, which is highly elevated historically and continues to create problems as the labour market struggles to absorb more and more foreign workers.”
“In the general market, the economy’s growth is not doing enough to cover the level of immigration which is at a high level relative to history.”
“While the jobless rate fell to 4 per cent in May from 4.1 per cent in April it was not enough to say inflation is being tamed.”
“It is our expectation that the Reserve Bank will not be considering any downward movement on rates before early 2025 and if politically feasible could move them up before that.”
“Predictions among economists are that general employment will fall off in the fourth quarter of this year, and, because employment of executives leads general employment by about a quarter, that there will be a drop off in executive demand around September.”
Among the states, New South Wales, Queensland and the ACT lead the way higher. The other states either made a small impact on the overall result or had a small loss.
In the business sectors, the federal government’s increased hiring saw an increase in Marketing and Financial executives. Overall, Marketing and Financial were the most significant sectors, with the other sectors also gaining ground.
Amid the states and regions, Queensland, NSW and the ACT were up the strongest.
Call Grant Montgomery on +612 9221 6688 or 0414926688 for further details
May 2024 Statistics
May 2024 National Index
May 2024 National Index: 557
Same period last year (May 2023): 696
Percentage change over last month: 10%
National Summary
The executive job market took back some of its recent losses in May as government hiring and the end of the financial year prompted increased demand. The Index rose 10 per cent.
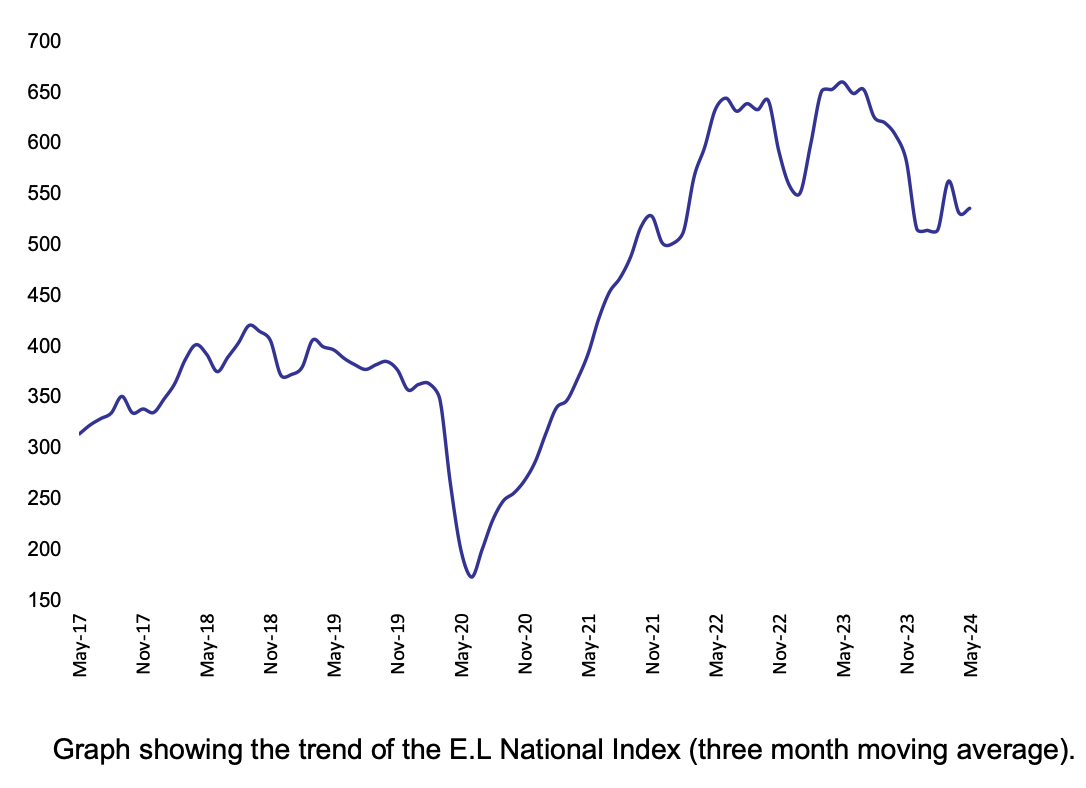
National Demand for Executives Over Last Seven Years
The three-monthly trend figure has shown some signs of an upturn after a significant fallout
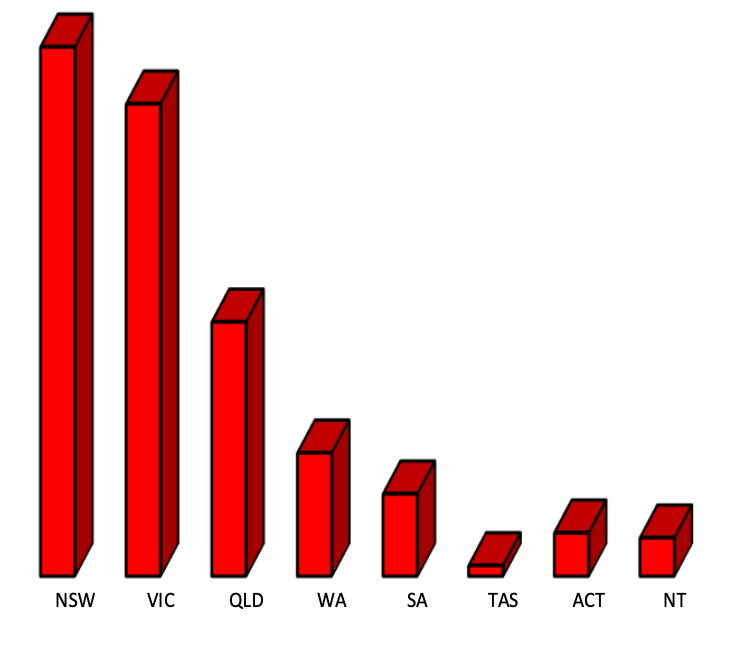
State by State Comparison
New South Wales, Queensland and the ACT lead the way higher. The other states either had small positive impact on the overall result or had a small loss.
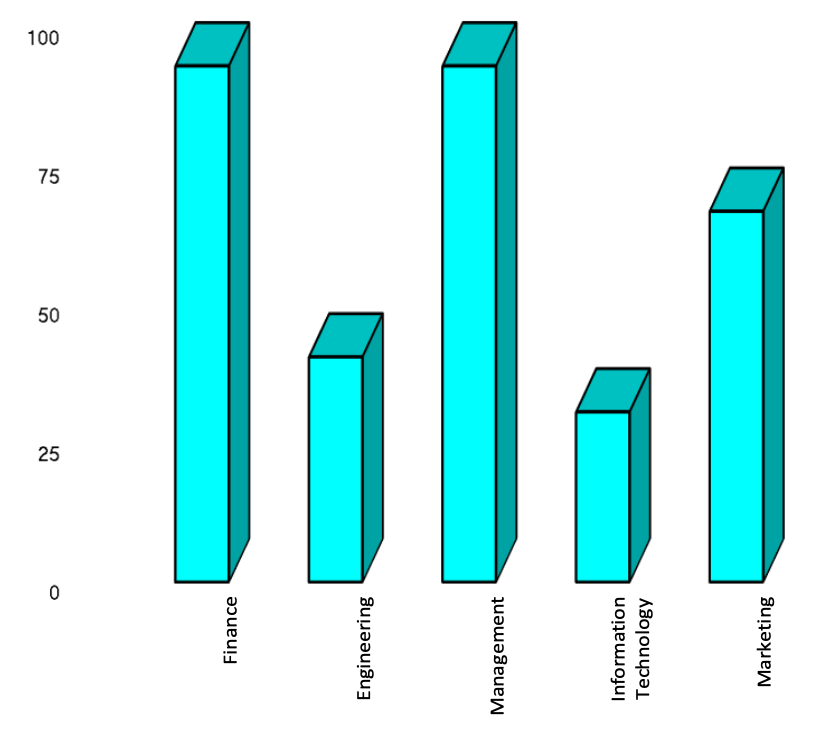
Employment Trends for Executive Groups
Federal government’s increased hiring saw a rise in Marketing and Financial executives which overall were the most significant sectors, though other sectors also gained ground.
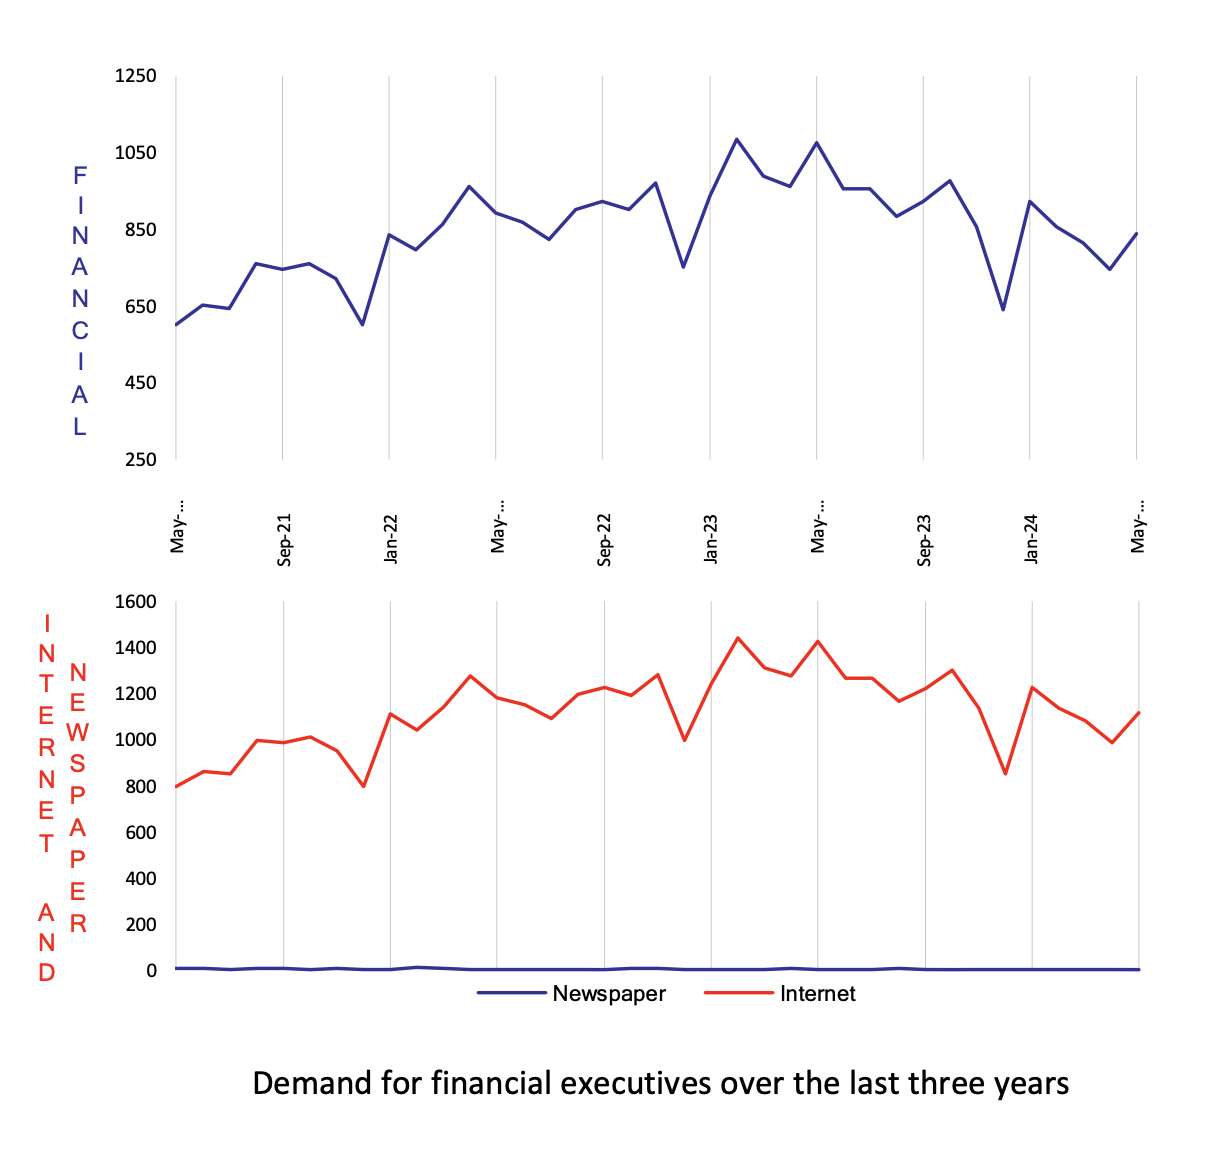
May 2024 E.L Finance Index
May 2024 E.L Finance Index: 838
Same period last year (May 2023): 1076
Percentage change over last month: 13%
Financial positions have recovered from a consecutive quarter of losses, rising 13 per cent in May.
The finance index actually seems to be turning around somewhat, and it is close to the middle of its recent trading range.
It benefited from strong performances from NSW and Victoria, and both business and government sectors.

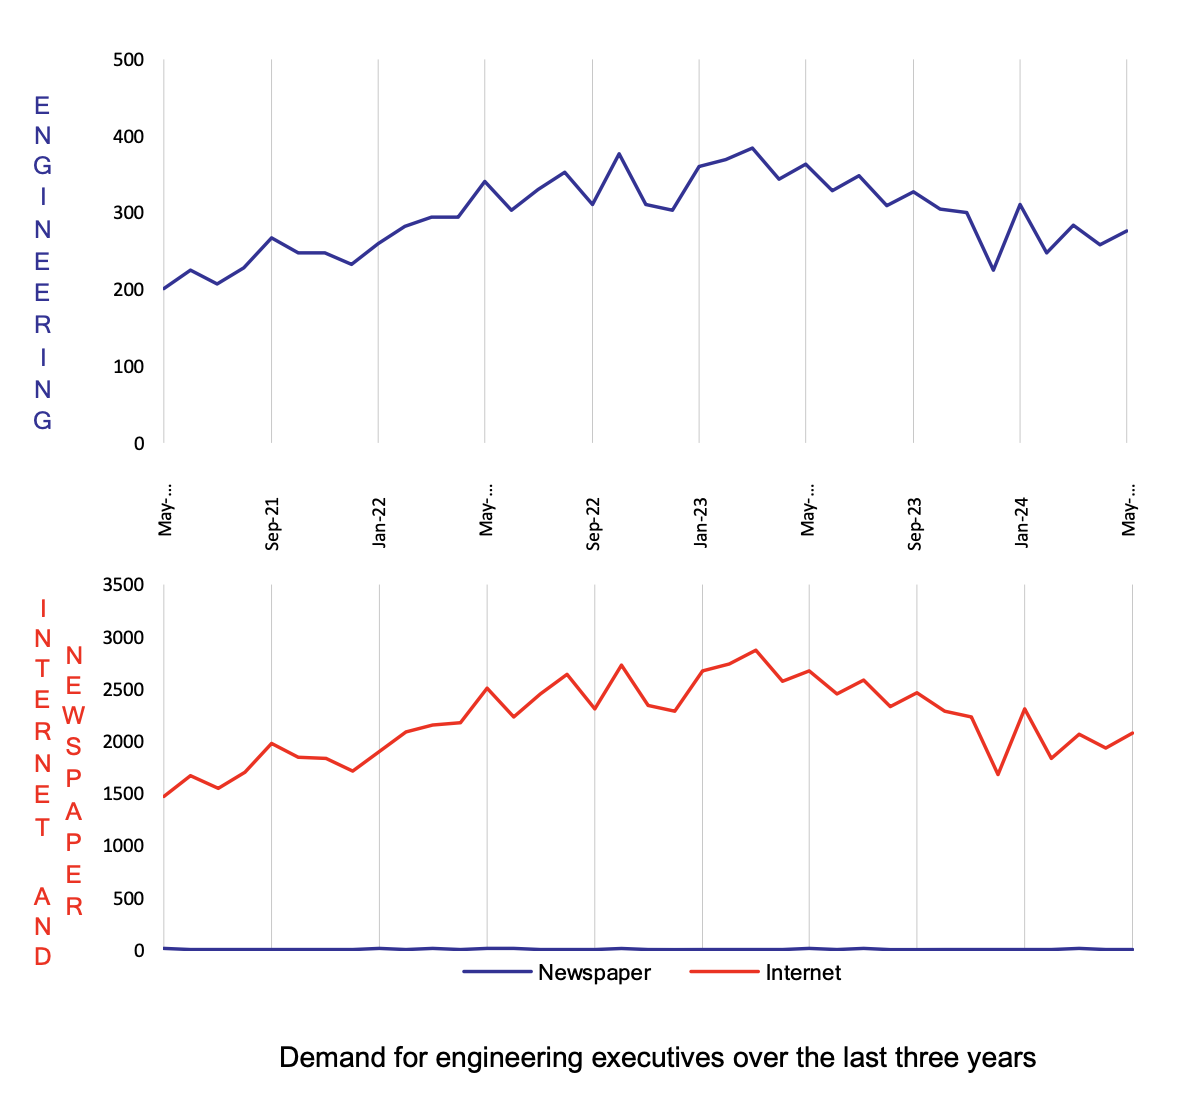
May 2024 E.L Engineering Index
May 2024 E.L Engineering Index: 277
Same period last year (May 2023): 363
Percentage change over last month: 7%
Engineering recorded a 7 per cent increase compared with the prior month.
Last month we mentioned that Engineering is having a “seemingly inexorable slide”. Well, despite this result, we would maintain that position that Engineering is going to continue to struggle over the long term due to continuing high interest rates and governments clamping down on projects.
Like other sectors, the gains were widespread across the country, particularly the medium-sized states of South Australia and Queensland.

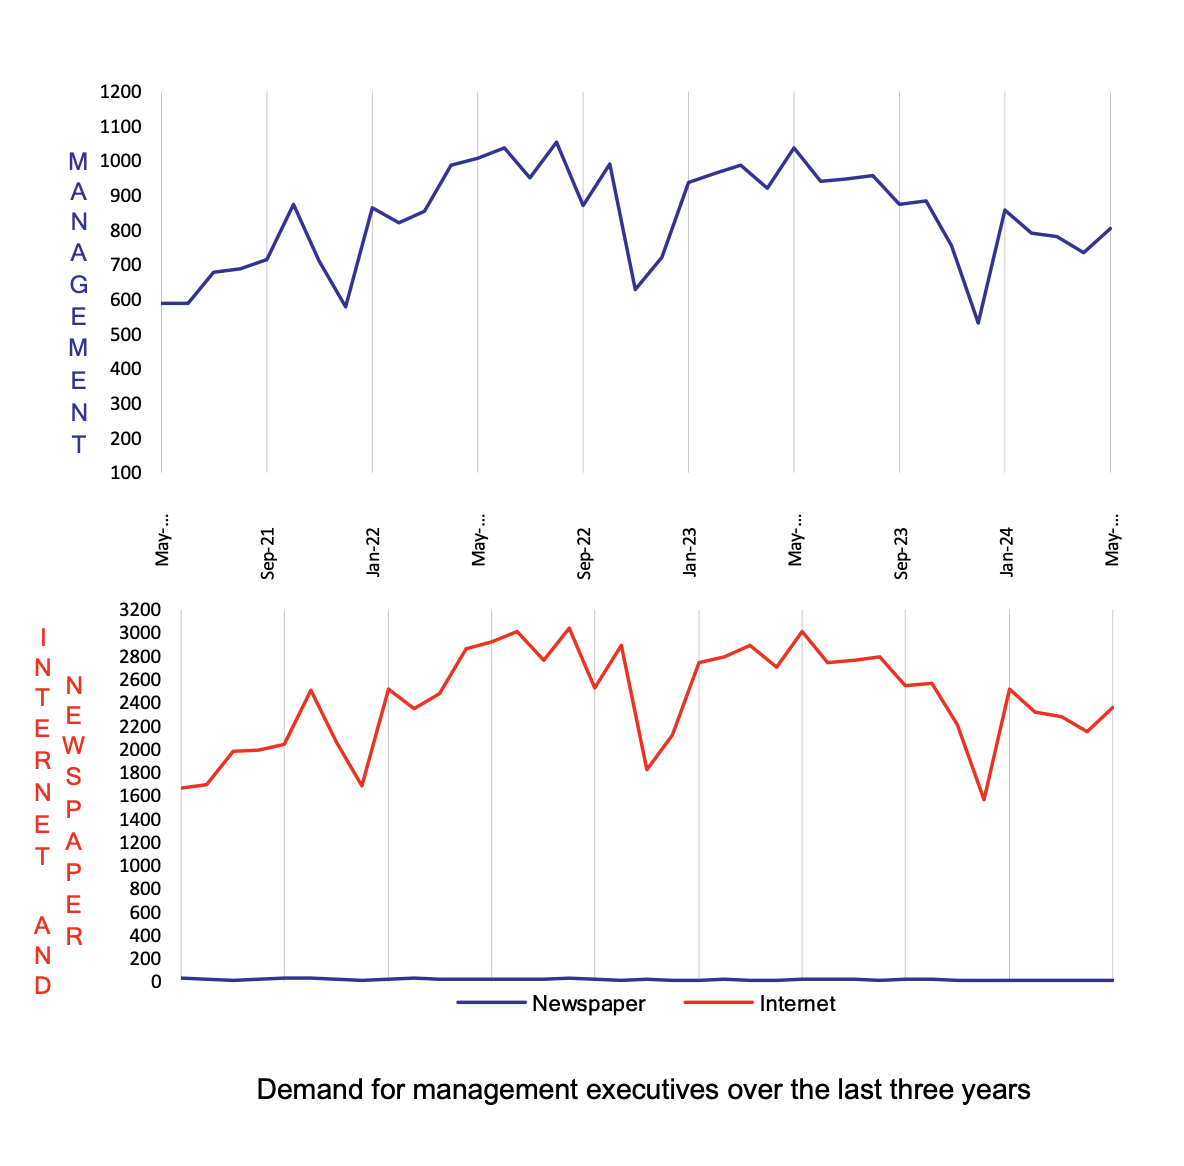
May 2024 E.L Management Index
May 2024 E.L Management Index: 804
Same period last year (May 2023): 1037
Percentage change over last month: 9%
The Management sector rose 9 per cent in May compared with the prior month.
The Management index has been more volatile than in prior years but is showing some signs of flattening out.
In May, gains across most states and territories were partially offset by losses in Western Australia.

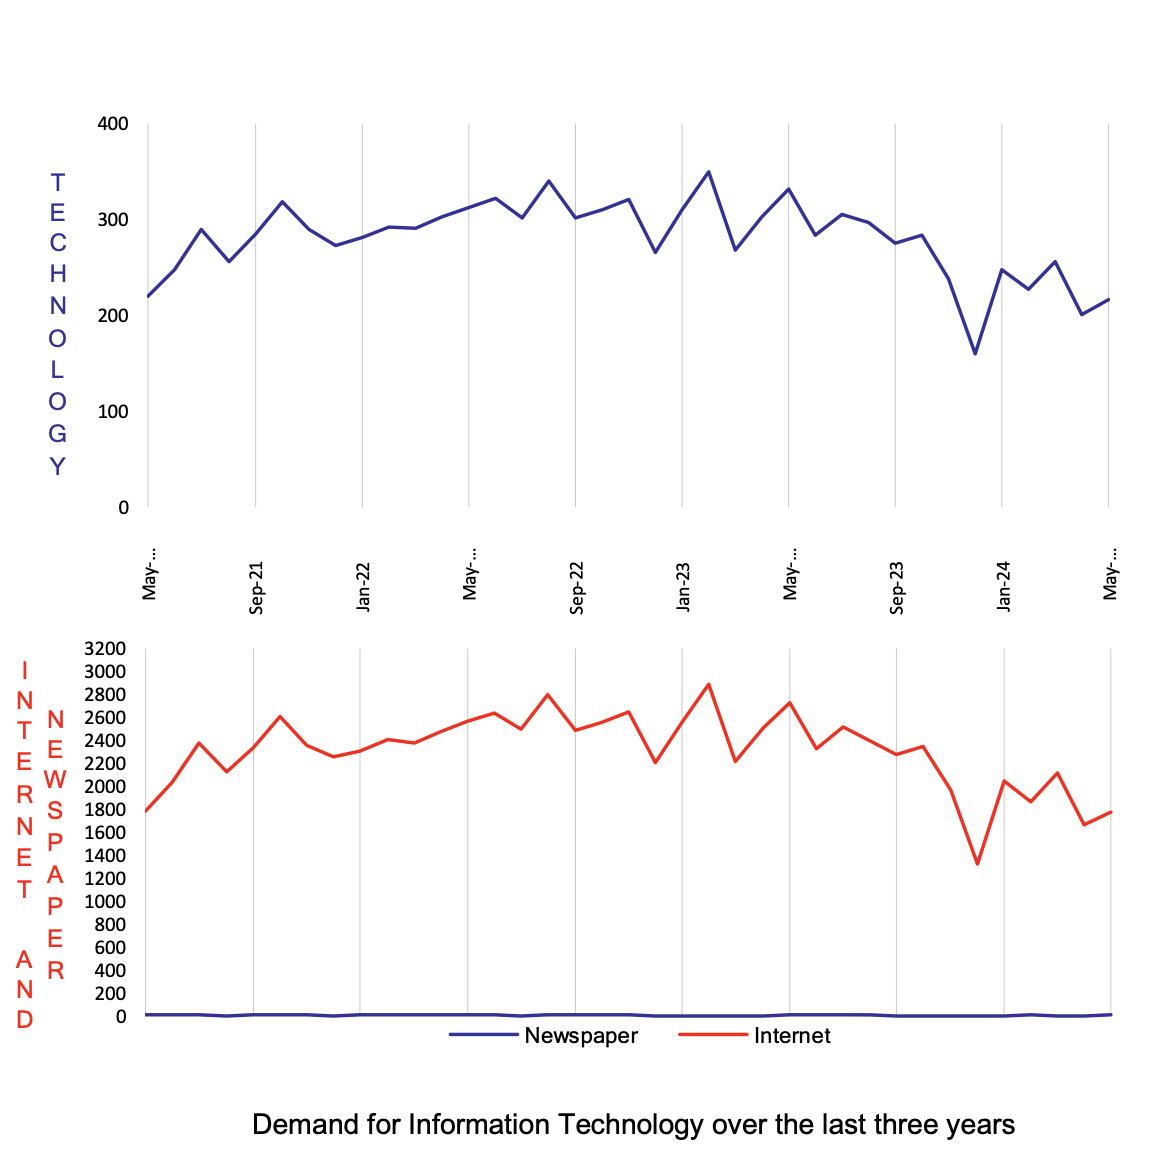
May 2024 E.L Information Technology Index
May 2024 E.L Information Technology Index: 216
Same period last year (May 2023): 331
Percentage change over last month: 7%
Information Technology rose 7 per cent in May.
This is a good sign, given the index fell off a cliff in the first half of 2023. The trend is now showing signs of stabilising.
Web advertising – the majority of demand – was higher in both the business and government sectors.

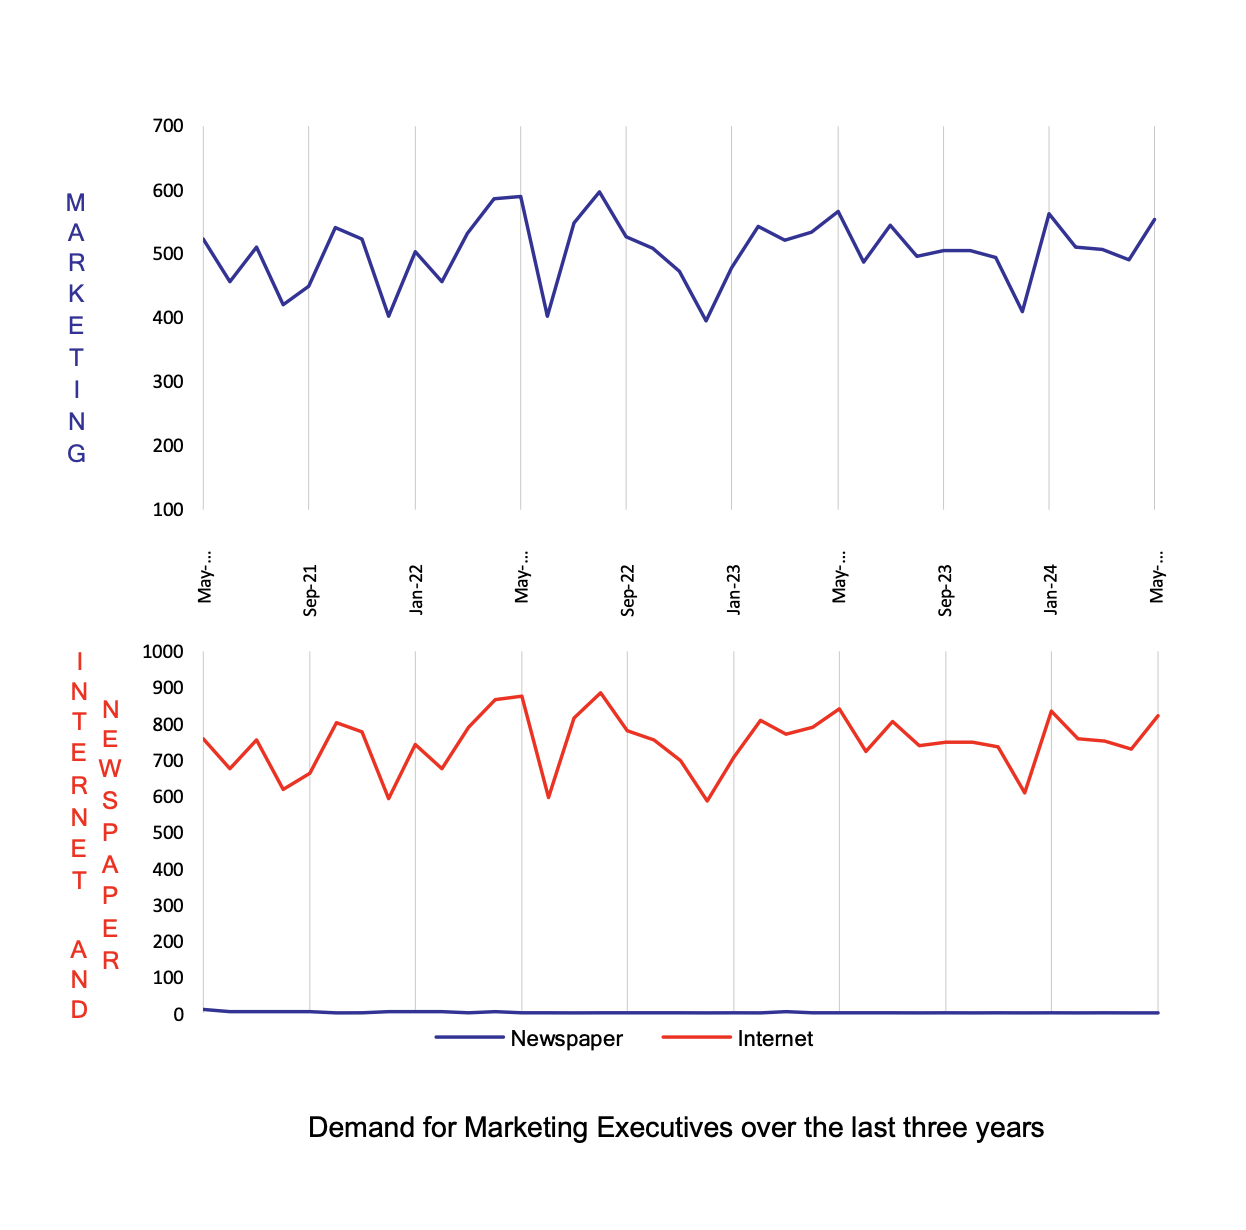
May 2024 E.L Marketing Index
May 2024 E.L Marketing Index: 553
Same period last year (May 2023): 566
Percentage change over last month: 13%
The Marketing index rose 13 per cent in May, matching the Financial index in making the biggest increase.
Although it did not get the Covid-related boost that other sector got in 2020-2022, it also did not get the big losses others got in 2023.
However, anecdotal evidence would seem to suggest that the Marketing sector is still specific to industries such as resources and construction. Financial services seems to not require marketers as the amount of flows in superannuation flows directly into internally managed funds.

About the E.L Index
The E.L Index is a comprehensive monthly analysis of employment trends at executive level. An Australian analysis is produced in Sydney and an Asian analysis in Hong Kong and Singapore.
The E.L Index has shown by two separate University studies to correlate strongly with general economic and business trends. It is featured by most of the major news services and is closely followed by government and central bank analysts.
The E.L Index is actually a combined national index of all executive demand made up of five separate indices; E.L Finance Index, E.L IT Index, E.L Management Index, E.L Marketing Index and the E.L Engineering Index.
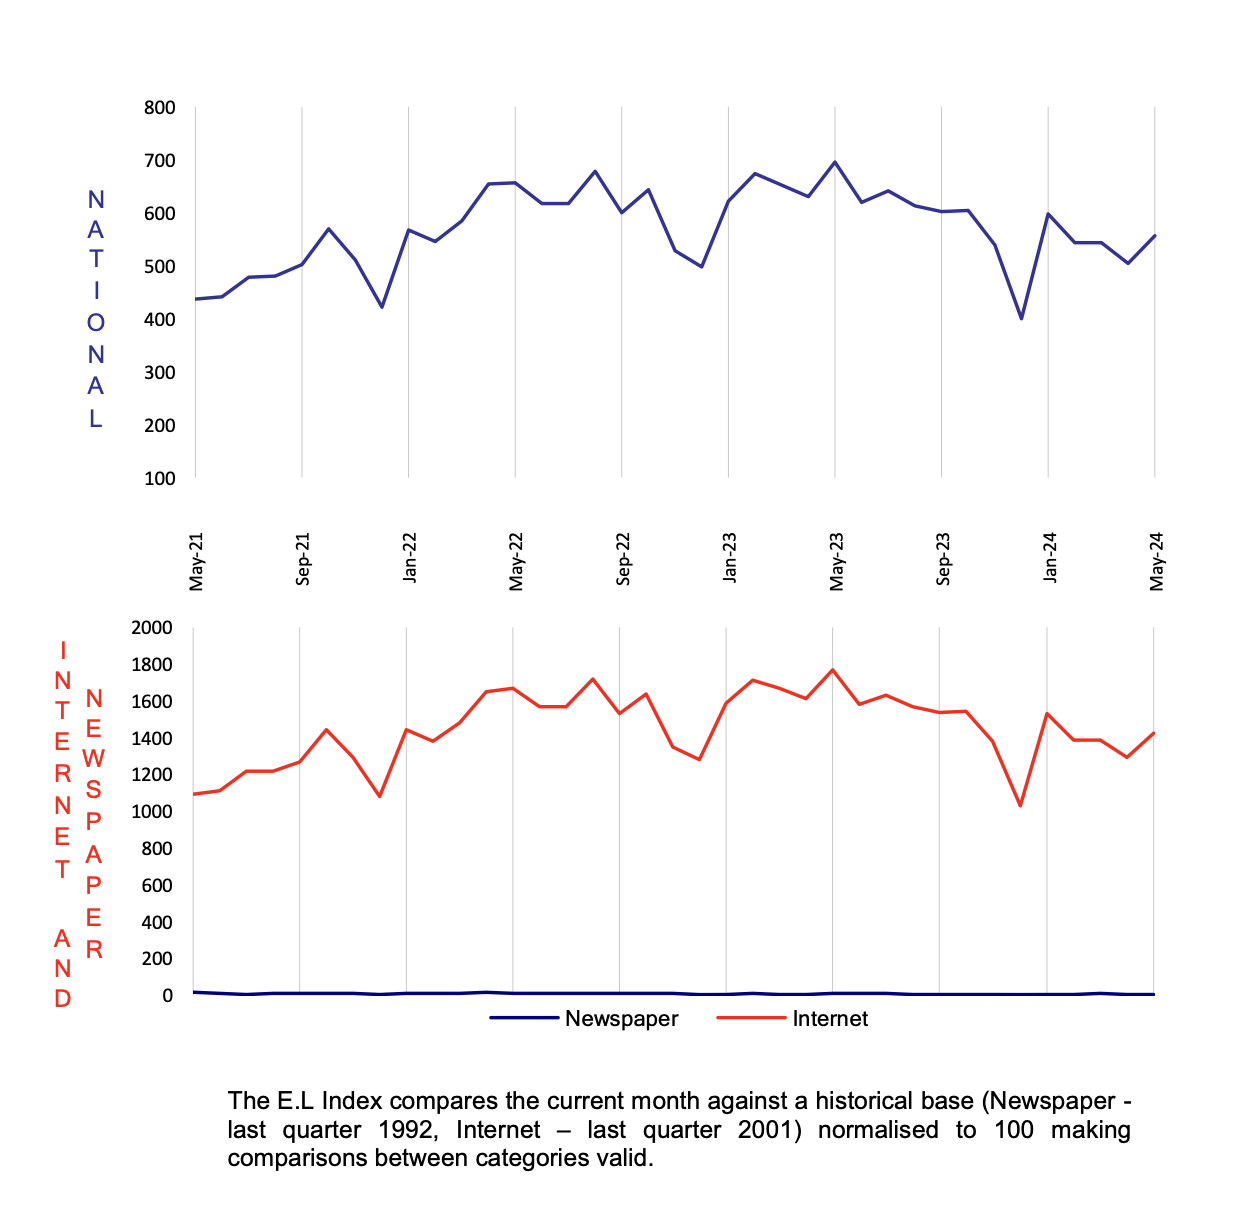
The National and specific career group Indexes are shown as relative indexes recording the monthly demand activity for executive positions in the current month against the demand in a historical base period which is normalised to 100. The historical base period used was the average of the last quarter of 1992 which research showed to be the bottom of that downturn.
By averaging to a historical base period the comparison of, say, June 1994 to June 2000 is meaningful, giving a clean, easily understood appreciation of changing investment and economic trends without seasonal obscurity.
The E.L Index utilises data from both print and internet sources and is the only employment index to do so.
The print data is collected from the major employment paper in each state. National papers are not used to avoid “doubling up”. Internet data is not collected off the web sites which can be subject to some error but instead collected through raw data provided by the ISP themselves. Print data has over 15 years of historical data and the internet more than 6 years.
Why Executive Demand is a Primary Lead Indicator?
It is often claimed that unemployment figures and broad-based job vacancy surveys do not give a fair impression of what is occurring in executive ranks. The E.L Index addresses this and has some interesting correlative and predictive qualities. Such as:
- Employment of management usually precedes the employment of skilled and unskilled workers.
- Employment of engineering executives precedes major capital investment.
- The division between various management sectors gives an indication of which sectors of the economy are experiencing growth or decline.
- Compares month-by-month changes in the public and private sector as well as monitoring government expenditure patterns.
- Makes regional comparisons after allowing for population differences.
- It shows a ‘rate of change’ and can therefore be realistically compared to general economic and employment growth, unlike some surveys that report absolute numbers.
- Core data is collected on an actual expenditure of business and government, not on a respondent’s opinion or confidence level.