Executive demand up 6 per cent
Against a backdrop of global instability, rising costs and ongoing geopolitical tension, Australian executive demand has unexpectedly increased — but the reason is far from reassuring.
The E.L. Executive Demand Index rose 6 per cent in March compared to the prior month, driven largely by continued expansion in government spending rather than underlying private sector strength.
Mr Grant Montgomery, Managing Director of E.L Consult, which has published the EL Index for more than 30 years, said the result reflects a growing imbalance in the Australian economy.
“Despite global disruption, the EL Index lifted 6 per cent nationally, with gains across every sector except Marketing. On the surface, that might look positive — but the underlying drivers tell a very different story.
“The 13 per cent surge in Management roles are heavily skewed toward government-related hiring. This is not organic economic growth — it is policy-driven expansion.
“As we move toward the May Budget, there is clearly no Government appetite to rein in public sector employment. At the same time, any meaningful comparison with private sector pay or productivity appears to have been abandoned.
“What we are seeing is a structural shift — increased spending, increased hiring, and an expanding class of publicly funded roles that do little to improve productivity.
“Highly paid government positions — including associate director roles exceeding $200,000 plus 17 per cent superannuation — are growing rapidly, while the private sector is actively cutting middle management to stay afloat.
“This divergence should be a serious concern. One sector is tightening to survive; the other is expanding without the same constraints.
“It is no surprise that the Australian Capital Territory led the country, rising 21 per cent. Both public and private sector demand in the ACT are now being driven by the same source — government expenditure.
“The risk is clear: an economy increasingly dependent on taxpayer-funded growth, rather than private sector productivity and investment.
“Government spending has now returned to COVID-era levels — but without a national emergency to justify it.
“Yes, fuel and operating costs are rising. But government expenditure is growing at a far faster rate than the broader economy, and that gap is unsustainable.”
Mr Montgomery said the current political environment increases the risk of this trend becoming entrenched.
“With a strong election result, the Federal Government now has a clear runway. The question is whether it uses that time to restore balance — or doubles down on a model that is already distorting the economy.
“If left unchecked, this approach risks undermining the very private sector that ultimately funds government activity.”
Despite broader concerns, there were some positive signals within the data.
Engineering roles rose 10 per cent, suggesting early signs of renewed capital investment.
“Engineering demand is one of the clearest indicators of real economic activity — investment in infrastructure, construction, plant and equipment. After a prolonged slowdown, this is one of the few genuinely encouraging signs for productivity.”
New South Wales and Victoria recorded gains, while Queensland eased slightly. The ACT was again the standout performer, driven by the flow-on effects of government spending.
Management roles led all categories, followed by Information Technology and Engineering. Marketing was the only sector to decline, although it continues to outperform over the longer term.
Call E.L Blue on +612 9221 6688 or 0414926688 for further details
March 2026 E.L Index National
|
March 2026 National Index: |
516 |
|
Same period last year (March 2025): |
494 |
|
Percentage change over last month: |
6% |
National Summary
The E.L Index rose 6 per cent in March compared to the prior month, led by public sector-related spending. Despite international turmoil, there were job gains in every sector except Marketing.
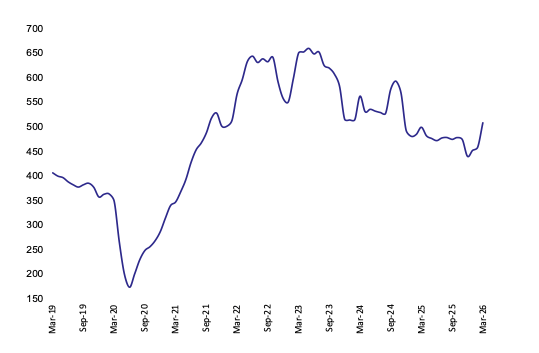
The executive demand long-term trend has risen sharply since the beginning of the year, benefiting from the seasonally-affected uptick in January and continuing gains in public sector-related hiring intentions.
National Demand for Executives over last Seven Years
The three-monthly trend has risen for the first time since May 2008 as a result of a positive last two months. In trend terms, we are clearly off the lowest point. The three-monthly trend has risen for the first time since May 2008, benefiting from two consecutive months of gains. The trend figure this time around seems to have reached its bottom or is close to it.
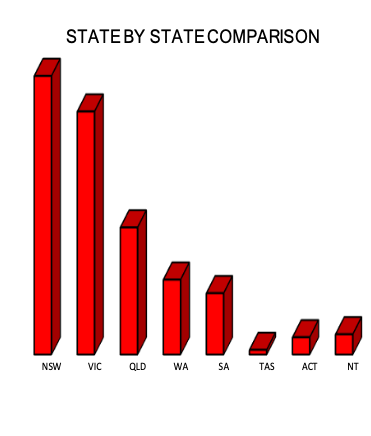
State
The largest states of NSWs and Victoria produced gains while Queensland was slightly lower. The ACT the best performer of all the regions, rising 21 per cent. While government sector employment provided most of the surge in the federal capital, business also grew within the public supported state.
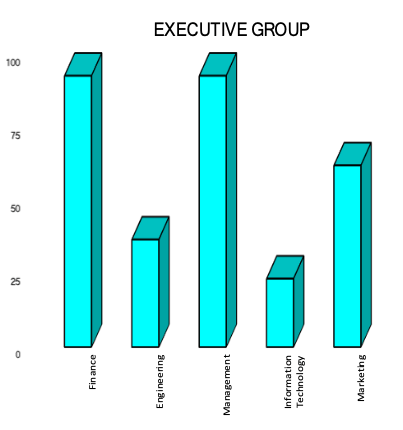
Executive
The best-performing group was Management, supported by unusual gains in NSWs, Victoria and the ACT, followed closely by Information Technology and Engineering. Marketing was the only sector to produce a negative result but on a longer-term trend basis is still outperforming the other sectors.
March 2026 E.L Index Finance
|
March 2026 E.L Finance Index: |
832 |
|
Same period last year (March 2025): |
834 |
|
Percentage change over last month: |
4% |
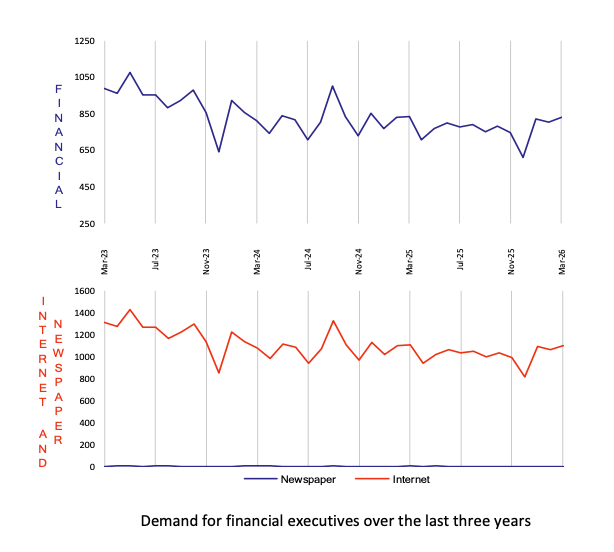
Finance’s trend has improved from the second half of 2025, aided by a 4 per cent increase in March compared with the prior month.
Again, led by NSW and WA, the Financial sector was unusual among the sub-indices in that the government sector played only a small part in the increase, with the business sector dominating the employment up-trend. This may have been influenced by the run-up to business year end, particularly given the amount of regulation that now needs to be complied with.
The weaker areas were the small regions of Tasmania and the Northern Territory, reversing the February experience.

March 2026 E.L Index Engineering
|
March 2026 E.L Engineering Index: |
252 |
|
Same period last year (March 2025): |
232 |
|
Percentage change over last month: |
10% |
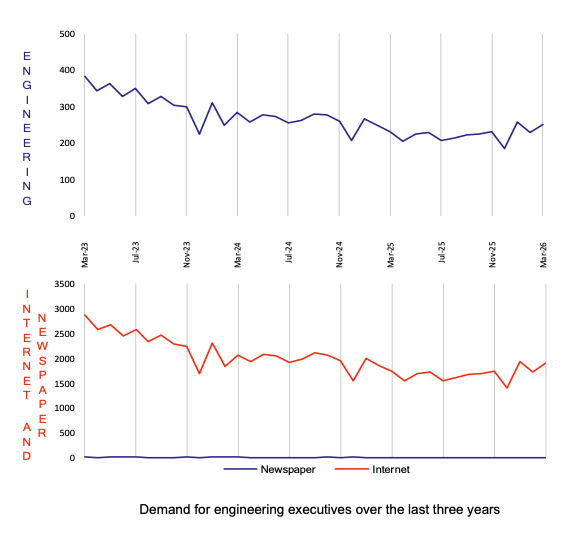
Engineering put in a solid performance in March, rising 10 per cent compared to the prior month to reverse the February losses.
The gains were relatively broad-based, with only Queensland recording a negative result. The gains were led by the largest states of New South Wales and Victoria.
Interestingly, in both New South Wales and Victoria government sector positions led the way higher, outpointing gains made in the business sector. This contrasts with the recent experience where business sector positions were stronger.

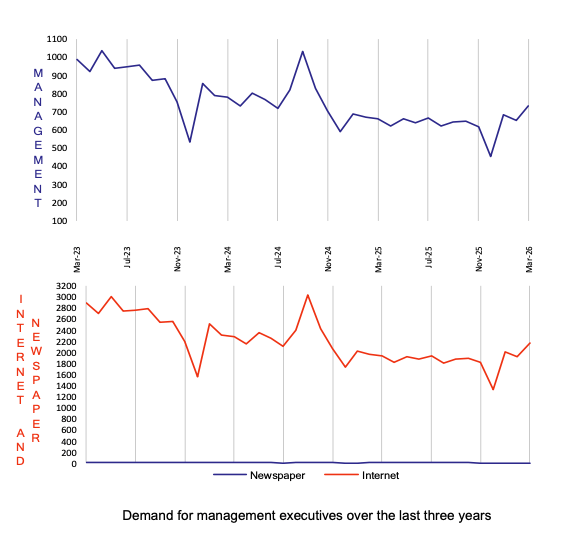
March 2026 E.L Management Index
|
March 2026 E.L Management Index: |
734 |
|
Same period last year (March 2025): |
661 |
|
Percentage change over last month: |
13% |
The best-performing group was Management, supported by unusual gains in New South Wales, Victoria and the ACT; unusual because there were significant increases in both the business and government sectors.
The Index rose 13 per cent in March to be the best-performing sector in the month.

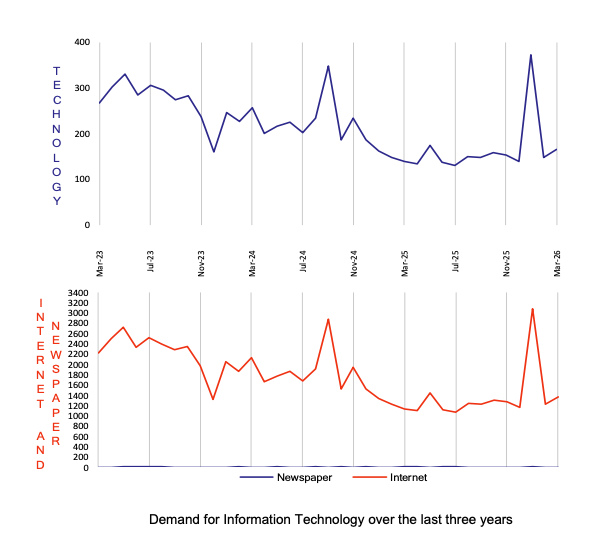
March 2026 E.L Information Technology Index
|
March 2026 E.L Information Technology Index: |
165 |
|
Same period last year (March 2025): |
138 |
|
Percentage change over last month: |
12% |
Information Technology has continued its recovery, gaining 12 per cent in March compared to the prior month.
If the January spike is taken out of the equation, in 2025 and into 2026 IT has stopped its fall since Covid and has at least halted its falls and has recovered somewhat.
The gains are clumped, with Western Australia and ACT showing significant gains, but Victoria and Queensland moving backwards. This reflects the sawtooth pattern of the broader ICT index.

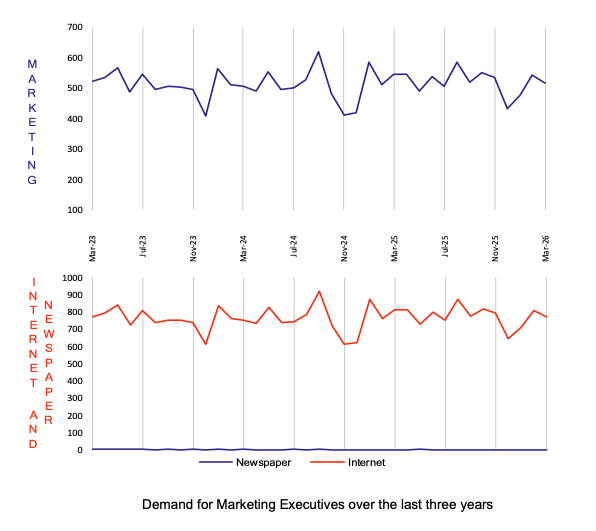
March 2026 E.L Marketing Index
|
March 2026 E.L Marketing Index: |
516 |
|
Same period last year (March 2025): |
544 |
|
Percentage change over last month: |
-5% |
The Marketing index was the only sector to pull back in March, falling 5 per cent compared to the prior month.
The index was undermined by retractions across a broad array of regions and business/ government sectors, particularly Queensland and South Australia, leaving the overall index in negative territory despite slight gains in Victoria and the ACT.
Despite the fall, he Marketing index remains the best performing of all the sectors in the post-Covid environment, with both the government and business sector holding the line on marketing spending. However, other sectors like Management seem to be catching up.

About the E.L Index
The E.L Index is a comprehensive monthly analysis of employment trends at executive level. An Australian analysis is produced in Sydney and an Asian analysis in Hong Kong and Singapore.
The E.L Index has shown by two separate University studies to correlate strongly with general economic and business trends. It is featured by most of the major news services and is closely followed by government and central bank analysts.
The E.L Index is actually a combined national index of all executive demand made up of five separate indices; E.L Finance Index, E.L IT Index, E.L Management Index, E.L Marketing Index and the E.L Engineering Index.
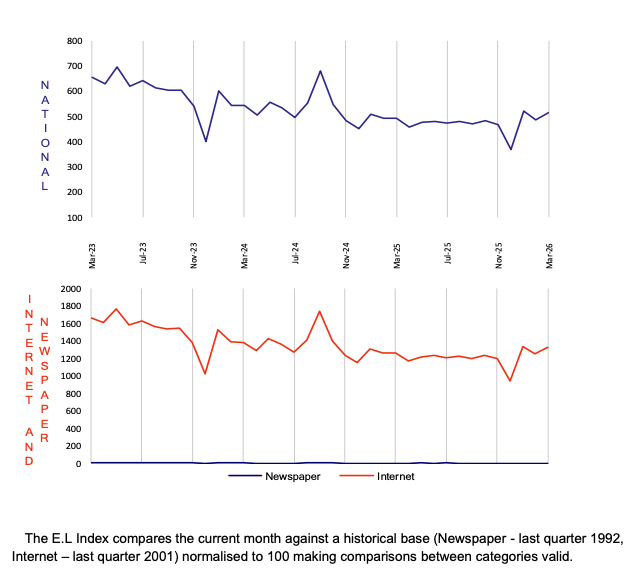
The National and specific career group Indexes are shown as relative indexes recording the monthly demand activity for executive positions in the current month against the demand in a historical base period which is normalised to 100. The historical base period used was the average of the last quarter of 1992 which research showed to be the bottom of that downturn.
By averaging to a historical base period the comparison of, say, June 1994 to June 2000 is meaningful, giving a clean, easily understood appreciation of changing investment and economic trends without seasonal obscurity.
The E.L Index utilises data from both print and internet sources and is the only employment index to do so.
The print data is collected from the major employment paper in each state. National papers are not used to avoid “doubling up”. Internet data is not collected off the web sites which can be subject to some error but instead collected through raw data provided by the ISP themselves. Print data has over 15 years of historical data and the internet more than 6 years.
Why Executive Demand is a Primary Lead Indicator?
It is often claimed that unemployment figures and broad-based job vacancy surveys do not give a fair impression of what is occurring in executive ranks. The E.L Index addresses this and has some interesting correlative and predictive qualities. Such as:
- Employment of management usually precedes the employment of skilled and unskilled workers.
- Employment of engineering executives precedes major capital investment.
- The division between various management sectors gives an indication of which sectors of the economy are experiencing growth or decline.
- Compares month by month changes in the public and private sector as well as monitoring government expenditure patterns.
- Makes regional comparisons after allowing for population differences.
- It shows a ‘rate of change’ and can therefore be realistically compared to general economic and employment growth unlike some surveys that report absolute numbers.
- Core data is collected on an actual expenditure of business and government, not on a respondent’s opinion or confidence level.