

Government employs more mandarins while the economy tanks.
Barely veiled socialism from Canberra has thrown executive level jobs demand into chaos, falling 20 per cent in June, according to the E.L. Executive Demand Index.
The decline comes hot on the heels of the budget’s capital gains tax grab which has severely weakened capital formation and caused executive demand in Australia to fall to its lowest since 2021.
Mr Grant Montgomery, Managing Director of E.L Consult, a leading executive search firm that has researched and published the E.L. Executive Demand Index for over 30 years, said the latest figures on executive jobs now reflect the broader economic weakness:
“Although last month was relatively positive in comparison, we are now seeing the employment data catching up with the reality of a country moving rapidly moving towards recession,
“A 20 per cent in the employment of executives is unheard of but it happened in June and shows that the full effect of the disastrous budget changes are now sinking in.
“Executive employment has historically been a lead indicator and the downturn will eventually hit all other employment…. except the public sector.
Montgomery said “For private sector companies, executive employment are a significant investment that ultimately must be supported by profitability.
“Employing higher level management is a question of confidence in the future and with hiring collapsing it appears is confidence in the future has collapsed. Businesses are voting with their feet.
We are at that grim stage right now.
“The situation is a direct result of government economic policies and uncontrolled spending. Australia now has the second highest inflation of any advanced economy sitting just behind Iceland.
“Despite the best of political ideology, it is not possible to change the whole basis of taxation, profit, aspiration, and innovation of thousands of hard-working Australians with a few meetings of mandarins with old, outdated concepts on tax and capital.
“Capital gains and negative gearing have been a sacred cow of the Labor party for a long time, but one gets the impression they have never actually thought it though. They just run the mantra ‘Negative gearing bad, taxation good’ Never trying to understand how they works and why” Montgomery said “The taxation changes might on the surface seem small, but they were a missile shot at the Australian economy’s engine room
“Capital and income cannot be seen in the same light. This is full socialism that has a long history of sending countries into poverty regardless of their resources.
“Capitalism has evolved by encouraging investment and enterprise. Policies that discourage private risk capital while expanding government spending destroys economic growth.
“Canberra believes that it can spend like crazy and tax any individual endeavour to pay for it is bad enough, but to tax older Australians on their accumulated savings and young people’s aspirations will create an underclass of central government hand out dependency that does not stand up to intellectual scrutiny” Mr Montgomery said.
“Of course, it will keep the current players in power and the immediate effect of falling employment will mean that the Reserve Bank is very unlikely to raise interest rates when the economy on life support.
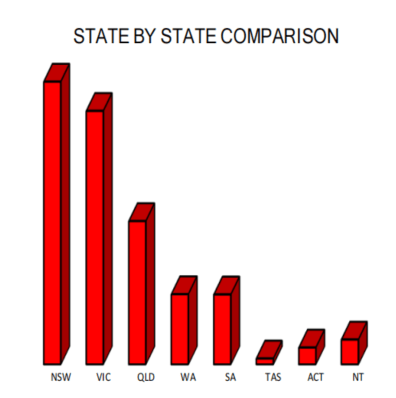
State by State Results.
• New South Wales was down 20 percent.
• Victoria was down 24 percent.
• Queensland was down \ 17 per cent.
All states and territories fell over the prior month. However, in New South Wales, the end of financial year produced a spending increase in its government sector, particularly in the areas of finance and management.
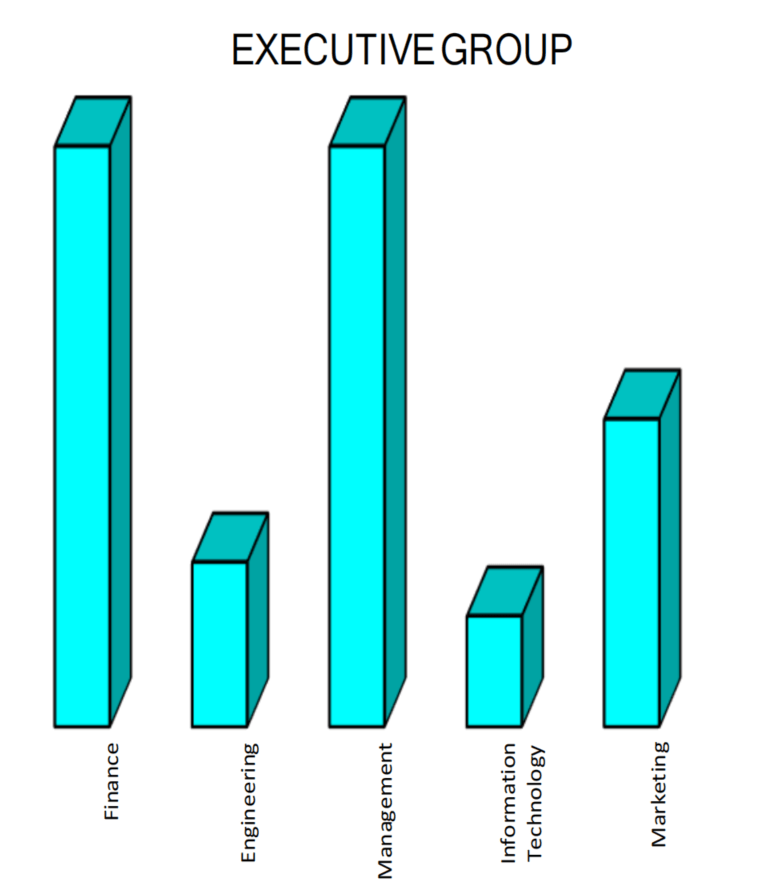
Industry results
Engineering fell the most due to a significant decline in both the government and business sectors. It was followed by Management and Marketing in recording the largest losses. The Financial sector saw significant weakness in the business sector as the other sectors but was pulled back a little by an increase in government positions due to expanded End of Financial Year reporting employment.
Call Grant Montgomery on +612 9221 6688 for further details.
|
June 2026 National Index: |
398 |
| Same period last year (June 2025): | 481 |
| Percentage change over last month: |
-20% |
National Summary
The E.L. Executive Demand Index fell 20 per cent in June compared with the prior month, two months after the changes to capital gains tax regime announced by the Federal Government in the Budget the surprising attack on capital formation. Executive demand in Australia has now fallen to its lowest non-Christmas holiday period result since 2021.
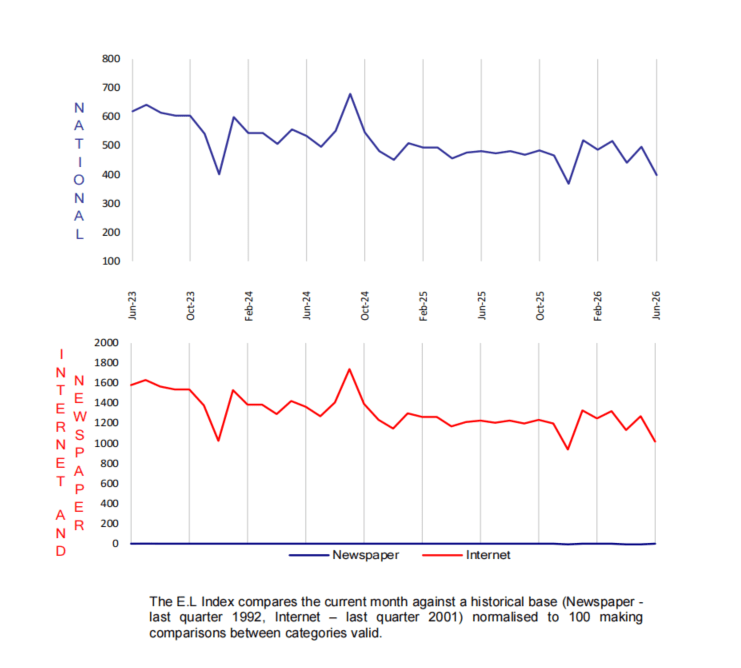
National Demand for Executives over last Seven Years
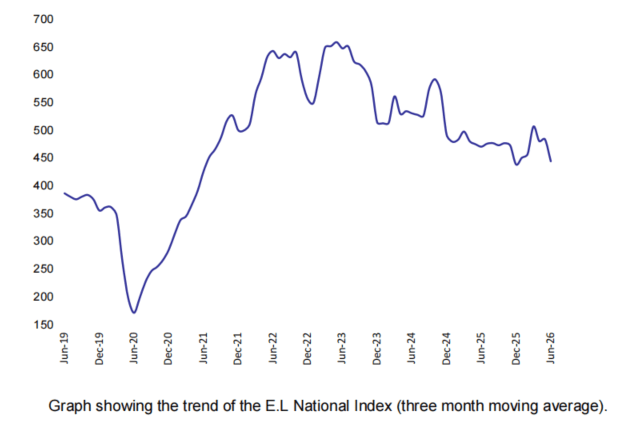
The executive demand long-term trend is now close to its lowest point since 2021 and the trend is largely negative after a short recovery in the first half of the year.
State
NSW and Victoria suffered fall of 20 per cent and 24 per cent respectively. The third largest state, Queensland, dropped 17 per cent. All states and territories fell. But end of financial year reporting has produced a spending increase a government spending increase in Finance and Management.
Executive
Engineering fell the most due to a significant decrease in both the government and business sectors. This was followed by Management and Marketing in recording the largest losses. The Financial sector saw the same amount of losses in the business sector as the other sectors but was pulled back a little by an increase in government positions due to expanding NSW employment.
June 2026 E.L Finance Index
|
June 2026 E.L Finance Index: |
705 |
| Same period last year (June 2025): | 801 |
| Percentage change over last month: |
-9% |
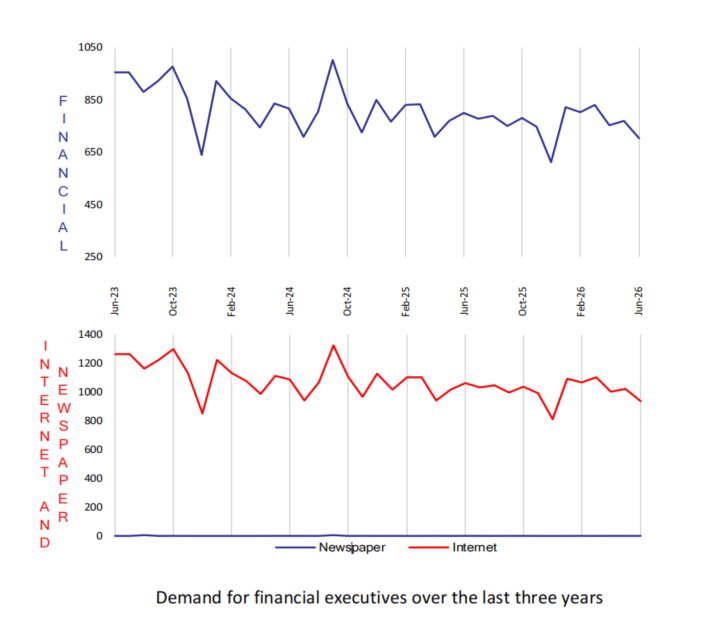
The EL Financial index proved the most resilient of the sectors this month but could not escape the general downdraft, falling 9 per cent compared with the prior month.
The losses in the business sector were broadly in line with those seen across the other sectors. However, the fall was cushioned by the government sector, in particular a 17 per cent rise in New South Wales government sector finance positions as the end of the financial year drove departmental hiring. Tasmania and South Australia were the only regions to record gains, while all the larger states fell, led by Queensland, with Western Australia and Victoria also weaker.
As has become the norm, the overwhelming majority of positions came from the business sector.

June 2026 E.L Engineering Index
|
June 2026 E.L Engineering Index: |
180 |
| Same period last year (June 2025): | 229 |
| Percentage change over last month: |
-29% |
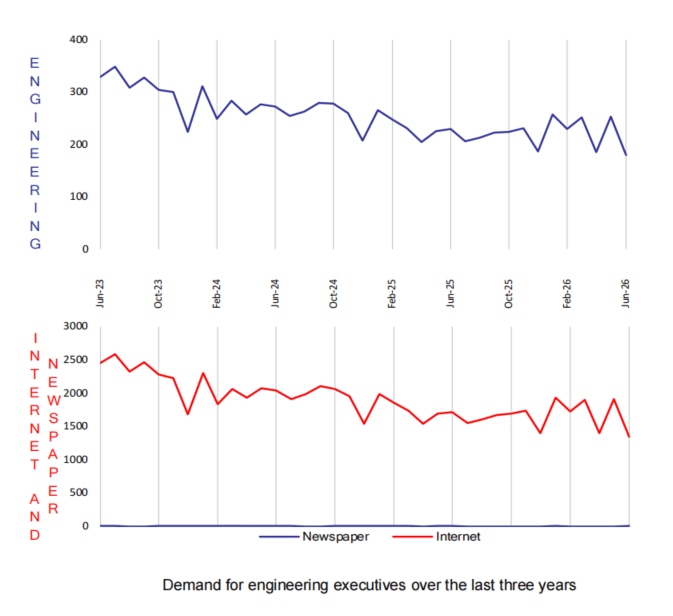
Engineering fell the hardest of all the sectors, dropping 29 per cent and surrendering almost all the previous month’s bounce to hit its lowest level since at least 2021. In the past year the sector has lost 21 per cent of positions.
The decline was broad and deep, with reductions in both the business and government sectors and falls in every region except for the Northern Territory. In percentage terms the losses were led by the ACT, then Victoria, Tasmania (off a small base) and South Australia.
As Engineering tends to lead capital investment and construction activity, the speed of the reversal is a poor signal for the broader economy. The government-driven gain of the prior month has proven lumpy and short-lived, consistent with demand that arrives at the start of projects and then falls away.

June 2026 E.L Management Index
| June 2026 E.L Management Index:: | 538 |
|
Same period last year (June 2025): |
641 |
| Percentage change over last month: |
-22% |
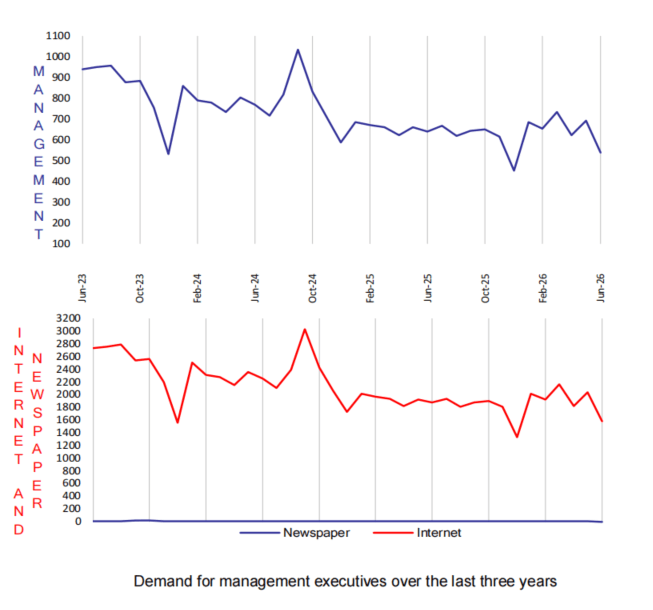
Management gave back the ground it gained last month and more, falling 22 per cent and dropping below its trading range of the past 12 months.
The losses were widespread and concentrated in the larger states, with Victoria, New South Wales, Queensland and Western Australia all falling heavily and South Australia the weakest of all. Only the Northern Territory and Tasmania managed gains, and both were off very small bases.
A 17 per cent rise in New South Wales government management positions, probably tied to end-of‐financial-year spending, did little to offset the retreat in business demand. Government hiring for managers has held up comparatively well on the back of infrastructure investment, but not enough to arrest the broader hollowing out of business sector management roles.

June 2026 E.L Information Technology Index
|
June 2026 E.L Information Technology Index: |
125 |
| Same period last year (June 2025): | 137 |
| Percentage change over last month: |
-18% |
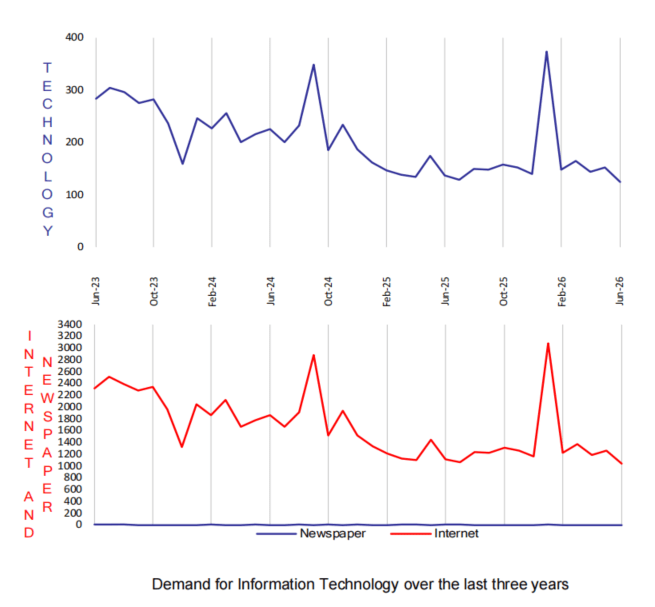
The Information and Communications Technology index fell 18 per cent, giving up the modest gain of the prior month. As always, the small number of positions on offer in this sector exaggerates its month-to-month percentage swings.
The losses were led by the ACT and New South Wales, with Victoria, Queensland and Western Australia also weaker. South Australia and Tasmania were the only regions to rise. Approximately 90 per cent of positions again came from the business sector.
The sector remains in flux; its direction clouded by the spread of artificial intelligence tools, which are allowing non-specialists to take on work that previously required dedicated technology executives to implement.

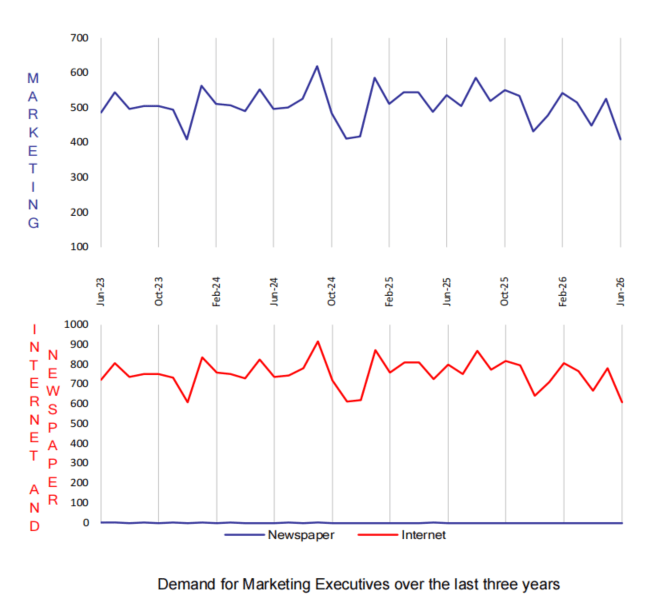
June 2026 E.L Marketing Index
|
June 2026 E.L Marketing Index: |
409 |
| Same period last year (June 2025): | 537 |
| Percentage change over last month: |
-22% |
Marketing, which had been among the more resilient sectors in recent months, was not spared, falling 22 per cent over the prior month.
This was almost entirely a business sector story, with government demand negligible. The larger states drove the fall, with Western Australia, Victoria and New South Wales all down sharply, while a minor gain in Queensland business positions allowed a smaller overall loss. South Australia and the ACT posted gains thanks to higher levels of business sector positions.
Given that Marketing had been outperforming the other sectors on a like-for-like basis, the sharpness of this reversal suggests the downturn has now spread across the entire market. Volatility in the sector remains elevated, perhaps signalling further large moves to come.

About the E.L Index
The E.L Index is a comprehensive monthly analysis of employment trends at executive level. An Australian analysis is produced in Sydney and an Asian analysis in Hong Kong and Singapore.
The E.L Index has shown by two separate University studies to correlate strongly with general economic and business trends. It is featured by most of the major news services and is closely followed by government and central bank analysts.
The E.L Index is actually a combined national index of all executive demand made up of five separate indices; E.L Finance Index, E.L IT Index, E.L Management Index, E.L Marketing Index and the E.L Engineering Index.
The National and specific career group Indexes are shown as relative indexes recording the monthly demand activity for executive positions in the current month against the demand in a historical base period which is normalised to 100. The historical base period used was the average of the last quarter of 1992 which research showed to be the bottom of that downturn.
By averaging to a historical base period the comparison of, say, June 1994 to June 2000 is meaningful, giving a clean, easily understood appreciation of changing investment and economic trends without seasonal obscurity.
The E.L Index utilises data from both print and internet sources and is the only employment index to do so.
The print data is collected from the major employment paper in each state. National papers are not used to avoid “doubling up”. Internet data is not collected off the web sites which can be subject to some error but instead collected through raw data provided by the ISP themselves. Print data has over 15 years of historical data and the internet more than 6 years.
Why Executive Demand is a Primary Lead Indicator?
It is often claimed that unemployment figures and broad-based job vacancy surveys do not give a fair impression of what is occurring in executive ranks. The E.L Index addresses this and has some interesting correlative and predictive qualities. Such as:
- Employment of management usually precedes the employment of skilled and unskilled workers.
- Employment of engineering executives precedes major capital investment.
- The division between various management sectors gives an indication of which sectors of the economy are experiencing growth or decline.
- Compares month by month changes in the public and private sector as well as monitoring government expenditure patterns.
- Makes regional comparisons after allowing for population differences.
- It shows a ‘rate of change’ and can therefore be realistically compared to general economic and employment growth unlike some surveys that report absolute numbers.
- Core data is collected on an actual expenditure of business and government, not on a respondent’s opinion or confidence level.